How to monitor memory usage of a Linux process
Last updated on August 7, 2020 by Dan Nanni
When you check memory usage of individual Linux processes, you may often use top command line utility. While top command is a solid program for system monitoring purposes, there are other enhanced versions of top, in terms of user-friendliness.
One such tool is called htop. The htop utility is an interactive process viewer for Linux. Similar to top, it shows resource usage of individual Linux processes in ncurses-driven text mode, but in much more user-friendly fashion.
To install htop on Ubuntu or Debian:
$ sudo apt-get install htop
To install htop on CentOS, RHEL or Fedora, first configure EPEL repository on your system and then run the following.
$ sudo yum install htop
To run htop, simply run:
$ htop

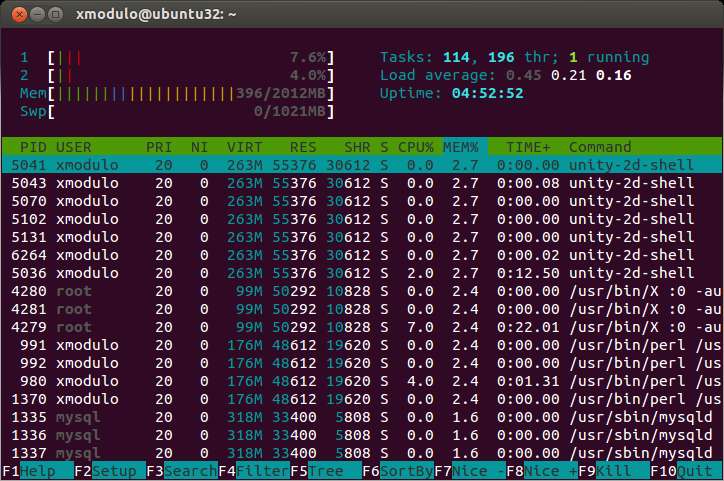
The screenshot of htop command is shown above. At the top of the screenshot, you can see the overall resource usage of the system: CPU usage (labeled 1 for the first CPU, 2 for the second CPU, etc.), memory usage and swap space usage. The rest information is similar to the output of top utility.
If you want to sort processes by memory usage, press <F6>, and choose MEM%.
With htop command, you can check a complete list of processes as opposed to top-N processes, by scrolling up/down the list. You can also scroll horizontally to see complete command line information of individual processes.
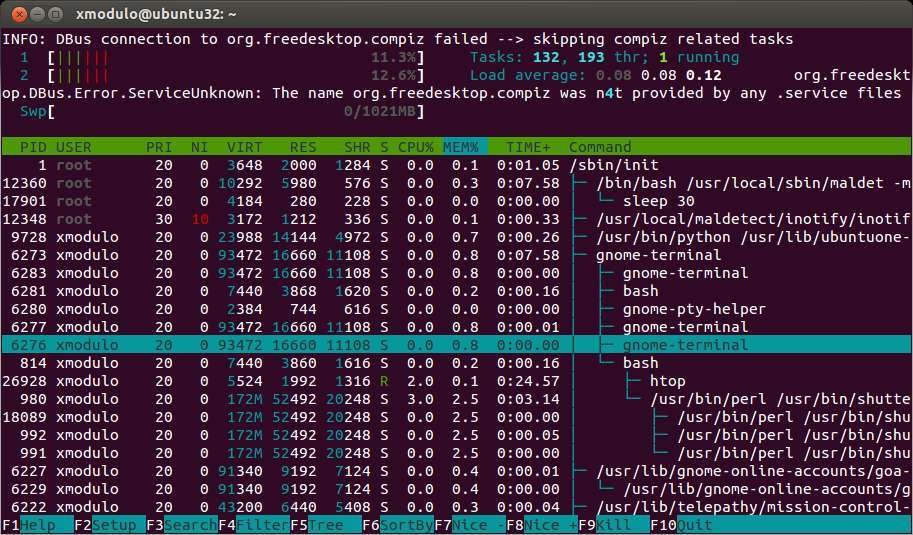
By toggling <F5>, you can enable or disable process tree views as shown below.

Besides keyboard, htop responds to mouse clicks as well. This is convenient when you nice or kill specific processes.
Support Xmodulo
This website is made possible by minimal ads and your gracious donation via PayPal or credit card
Please note that this article is published by Xmodulo.com under a Creative Commons Attribution-ShareAlike 3.0 Unported License. If you would like to use the whole or any part of this article, you need to cite this web page at Xmodulo.com as the original source.
Xmodulo © 2021 ‒ About ‒ Write for Us ‒ Feed ‒ Powered by DigitalOcean

