How to create a cool terminal dashboard in Linux
Last updated on September 9, 2020 by Adrien Brochard
Are you looking for new ways to display information in Linux? Is Conky is too mainstream for you? Are you looking for something more geeky and flexible than screenFetch? Then maybe you should consider making a dashboard in your terminal. And for this, I like to use Hubble, a small application based on the Node.js platform.
The concept of Hubble is simple: you launch the program in a big terminal window, and it will display any information that communicates with it via a custom HTTP port 9999 on your machine. In other words, any program capable of pushing some data via HTTP will be able to exchange with Hubble. This makes Hubble easy to interact with and highly flexible. But I think that a bit of practice and a few examples will convince you better than I can.
Installation of Hubble
To install Hubble, you will need the node package manager (npm).
For Debian or Ubuntu:
$ sudo apt-get install npm
$ sudo ln -s /usr/bin/nodejs /usr/bin/node
For Arch Linux:
$ sudo pacman -S npm
For Fedora, and CentOS/RHEL with EPEL:
$ sudo yum install npm
Once npm is set up, you can install Hubble with:
$ sudo npm install -g coffee-script
$ sudo npm install -g hubble
And you should hopefully be all set then.
Usage of Hubble
As mentioned earlier, Hubble is like your best friend waiting for hot gossip. It listens on TCP port 9999 on your localhost machine and displays information. To begin, simply launch it in your terminal via:
$ hubble
Notice that you might have an error message if your window is not big enough. If this is the case, just enter into full screen mode.
From there, press the Y key to make a new configuration file. The file config.coffee should be sitting in your current directory. This is a very standard configuration aspect of Hubble. Put simply, you can modify the title, remove the banner, or modify the port number that's being listened on. The most advanced features will be explained later, when they will make a bit more sense in context.
The most interesting aspect of Hubble is the way you can communicate with it. There are two ways: post information via HTTP, or tell Hubble to query it itself. To post information directly, I like to use curl, which is a very useful program to have in general. The syntax works like this:
$ curl --data "column=[column #]&label=[label to display]&value=[value to display]" [address]
In a less abstract way,
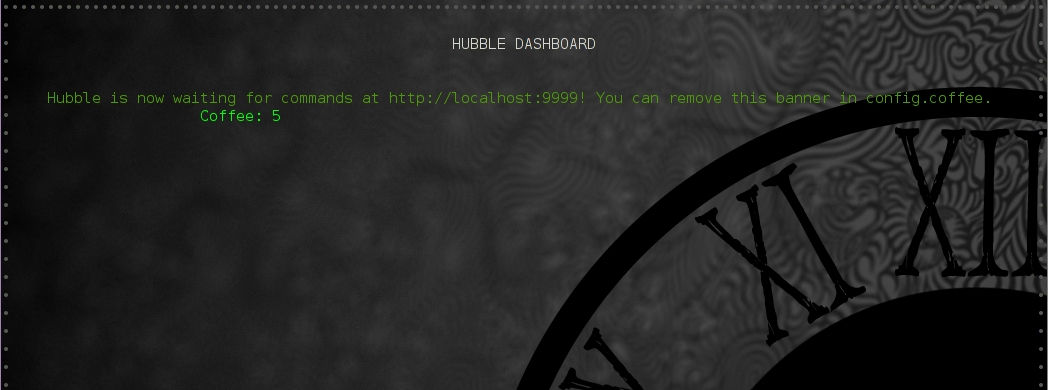
$ curl --data "column=0&label=Coffee&value=5" http://localhost:9999/
will display this:

From there, you can decrement or increment the value with the syntax:
$ curl --data "column=0&label=Coffee&value=increment" http://localhost:9999/
Or even set a threshold via:
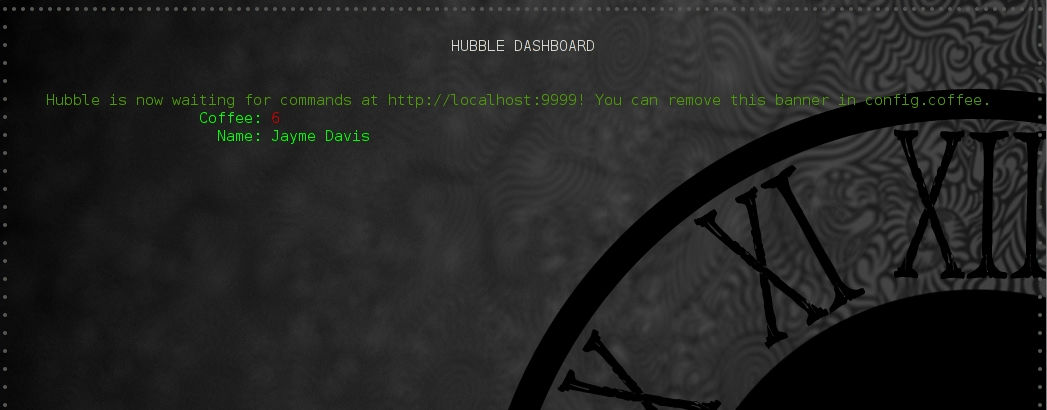
$ curl --data "column=0&label=Coffee&value=6&high=5" http://localhost:9999/

Notice that once the value is past that threshold, the text color will change to what has been specified in the config.coffee file under:
high: 'red'
The second way to have data show up is to have Hubble query the data itself. This is done by posting to it once with the syntax:
$ curl http://localhost:9999
-d column=[column #]
-d label="[label name]"
-d poll_url="[URL to poll]"
-d poll_seconds=[number of seconds between polls]
-d poll_failed="[message to display if failed]"
-d poll_method="[how to parse the data]"
As an example, this would be:
$ curl http://localhost:9999
-d column=0
-d label="Name"
-d poll_url="https://api.github.com/users/jaymedavis"
-d poll_seconds=10
-d poll_failed="Bummer :("
-d poll_method="json_value:^.[0].name"
This displays the name of Hubble's creator under the label Name in the first column. Notice that the query is done every 10 seconds, and returns a JSON file. Hubble can parse the JSON, and return the value under the tag name with the correct parsing method.

In general, Hubble can parse JSON files, and even count the number of elements in an array. From that, it is up to you to be creative and use your favorite APIs.
Last but not least of Hubble's features, you can have multiple screens displayed. In other words, load a different dashboard by pressing a specific key. To set up this other screen, use the syntax:
$ curl --data "column=0&label=Coffee&value=5&screen=[key to press to see the second screen]" http://localhost:9999/
So for example:
$ curl --data "column=0&label=Coffee&value=5&screen=h" http://localhost:9999/
displays another coffee label on a separate screen, that you would display by pressing h.
Finally, once you have all your information nicely spread and displayed in your dashboard, you can save your configuration to a script file via:
$ curl --data "filename=[coffee script name]" http://localhost:9999/save
and load it back through:
$ hubble [coffe script name]
To conclude, I really like Hubble. The idea of having a dashboard is not for everyone, and there are quite a lot of configurations and creativity needed to make it work, but the result is always on par with the effort. The only feature left to be desired is a native way to have Hubble switch screens based on time. In others words, alternate automatically between screens every minute for example. Anyway, it is a great project and from there I can only direct you to the official GitHub page for the project. Kudos to the developers.
What do you think of Hubble? Is it too complex? Would you invest some time in it? And if so, what does your dashboard look like? Let us know in the comments.
Support Xmodulo
This website is made possible by minimal ads and your gracious donation via PayPal or credit card
Please note that this article is published by Xmodulo.com under a Creative Commons Attribution-ShareAlike 3.0 Unported License. If you would like to use the whole or any part of this article, you need to cite this web page at Xmodulo.com as the original source.
Xmodulo © 2021 ‒ About ‒ Write for Us ‒ Feed ‒ Powered by DigitalOcean

