How to overlay two plots in Gnuplot
Last updated on July 26, 2020 by Dan Nanni
Sometimes you may want to include multiple plots in one figure. For example, you draw one plot, and then add a smaller size plot on top of it as an overlay. Gnuplot has a multiplot feature which allows you to create various kinds of multiplot layouts including stacked plots or overlay plots, etc.
In this Gnuplot example, I show you how to overlay two plots in Gnuplot using multiplot feature. Here I want to overlay a small plot on top of another plot.
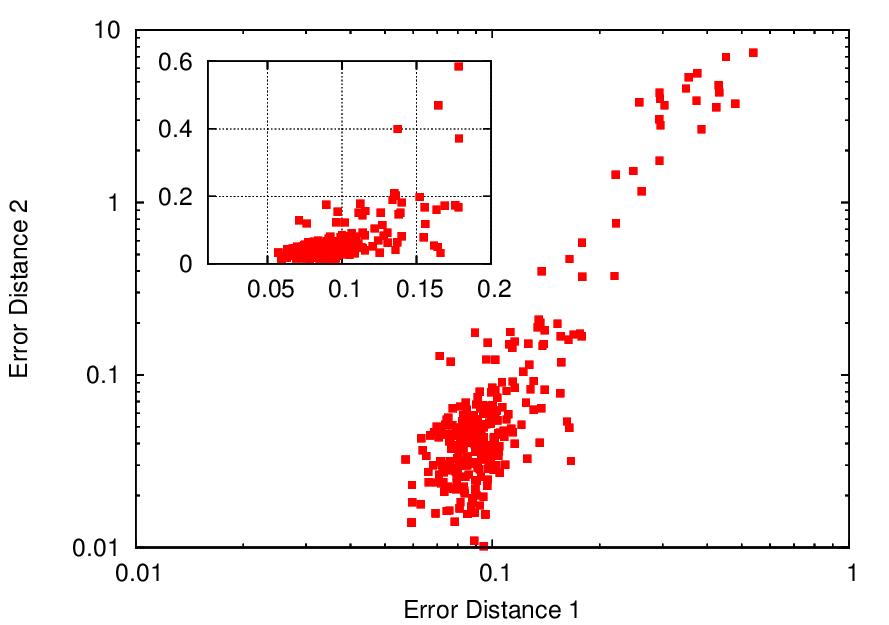
#!/usr/bin/gnuplot

set terminal postscript eps enhanced color "Helvetica" 20
set output 'my_data.eps'

# beginning of multiplot
set multiplot

# the first plot
set size 1,1
set origin 0,0
set xlabel "Error Distance 1"
set ylabel "Error Distance 2"
set log x
set log y
set xrange[0.01:1]
plot    "my_data.m" title "" with p pt 5

# smaller overlay plot
set size 0.45,0.45
set origin 0.15,0.5
set xrange [:0.2]
set lmargin 5
unset xlabel
unset ylabel
unset arrow
unset logscale
set xtics 0.05
set ytics 0.2
set grid
plot    "my_data.m" title "" with p pt 5

# end of multiplot
unset multiplot
As shown above, when you include multiple overlapping plots in one figure using multiplot feature, you can set the size and position parameters of each plot manually. You can also define x/y label, x/y range, title, etc. for each plot independently. The above Gnuplot script will generate a following look.
Support Xmodulo
This website is made possible by minimal ads and your gracious donation via PayPal or credit card
Please note that this article is published by Xmodulo.com under a Creative Commons Attribution-ShareAlike 3.0 Unported License. If you would like to use the whole or any part of this article, you need to cite this web page at Xmodulo.com as the original source.

Xmodulo © 2021 ‒ About ‒ Write for Us ‒ Feed ‒ Powered by DigitalOcean