How to scan network with Nmap GUI
Last updated on August 29, 2020 by Dan Nanni
Nmap is popular network scanner software that can actively probe a particular host or a network to infer in-depth information about them. Nmap can conduct host discovery, service detection, OS version identification, port scanning, network stack fingerprinting, etc. While Nmap itself is a versatile command-line utility, you can run it along with its GUI front-end called Zenmap, which improves usability of the Nmap tool.
In this tutorial, I will describe how to scan particular hosts or networks by using Nmap GUI.
Install Nmap GUI on Linux
To install Zenmap on Debian, Ubuntu or Linux Mint:
$ sudo apt-get install zenmap
To install Zenmap on Fedora, CentOS or RHEL:
$ sudo yum install nmap-frontend
Scan Networks with Zenmap
To launch Nmap GUI, run the following command with root privilege.
$ sudo zenmap
The following screenshot shows the main window of Zenmap.

Scan Particular Host(s)
Using Zenmap interface, you can probe a particular host. Fill in the IP address or host name of a destination host in Target field, and choose a desired scan profile from Profile drop down menu. Then, click on Scan button. For multiple hosts, you can specify them in a comma-separated list.
To check the detailed system information of a particular host after scanning, highlight a host in the left panel, and click on Host Details tab on the right panel.

To view available services and open ports of a host, click on Ports / Hosts tab.

Compare Two Scan Results
When one round of host/network scanning is completed, you can start another round (for the same target or different one) in the same window. The subsequent scan results will automatically be aggregated by Zenmap. Once you have obtained scan results of more than one hosts, you can compare two hosts. To do so, go to Tools → Compare Results menu, and choose two hosts to compare.

Scan an Entire Network
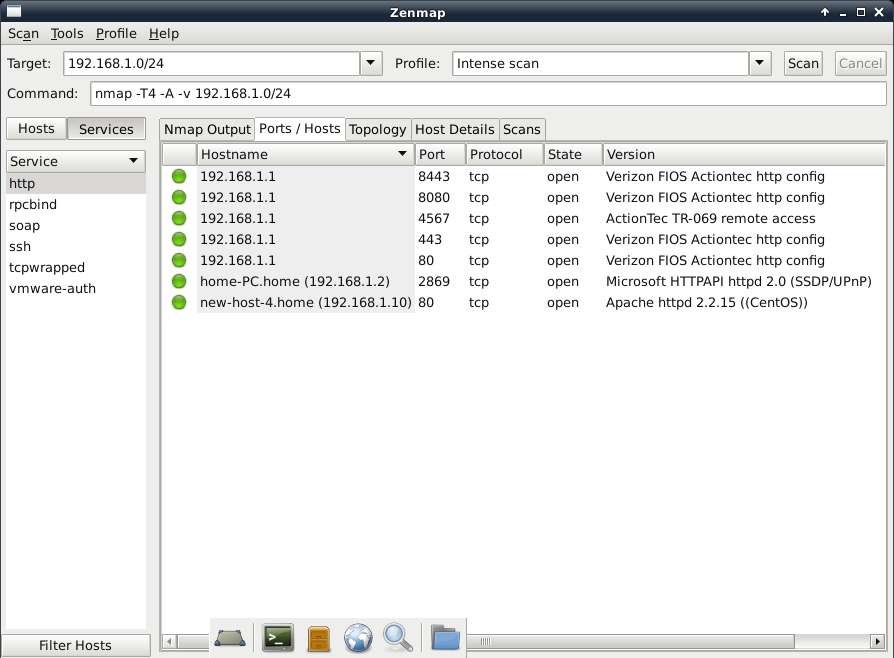
Zenmap can also probe an entire local network by specifying an address prefix (e.g., 192.168.1.0/24) in the Target field.
Once network scanning is completed, you can view the topology of discovered hosts by clicking on Topology tab.

To view a list of available services, click on Services button on the left panel. You can see a list of all discovered services and their associated hosts, as shown below.

Built-in Profile Editor
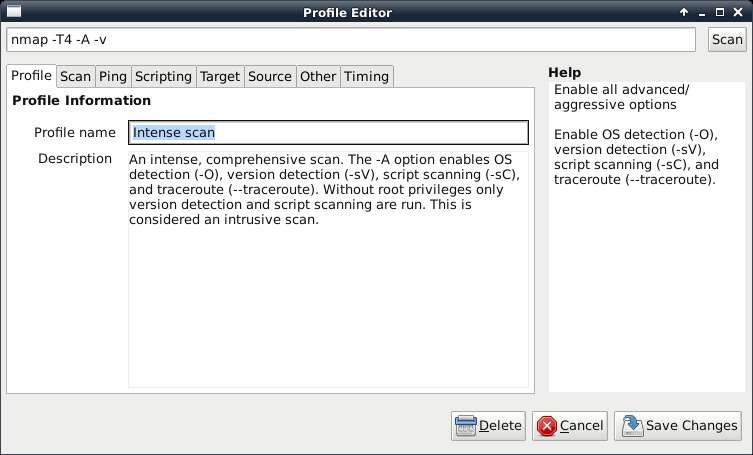
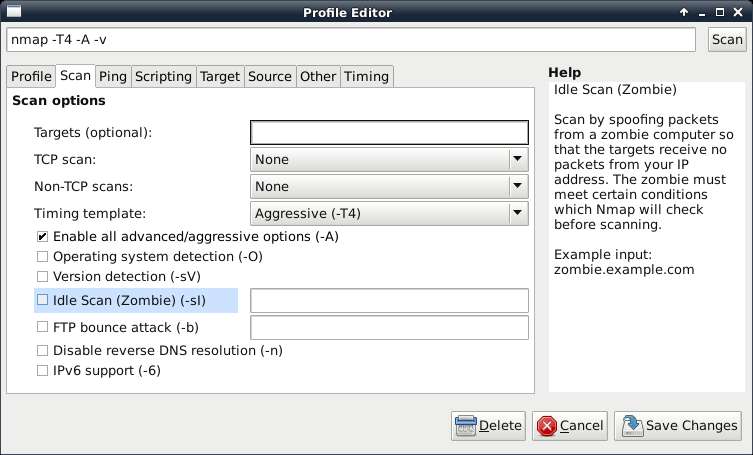
One powerful feature of Zenmap is its built-in profile editor. You can create or customize a profile where you specify various scan options via GUI. Once a profile is created, you can probe hosts or networks based on the profile. The below shows screenshots of the profile editor.


Support Xmodulo
This website is made possible by minimal ads and your gracious donation via PayPal or credit card
Please note that this article is published by Xmodulo.com under a Creative Commons Attribution-ShareAlike 3.0 Unported License. If you would like to use the whole or any part of this article, you need to cite this web page at Xmodulo.com as the original source.
Xmodulo © 2021 ‒ About ‒ Write for Us ‒ Feed ‒ Powered by DigitalOcean

