How to install and configure Nagios on Linux
Last updated on September 30, 2020 by Sarmed Rahman
Nagios is one of the most powerful network monitoring systems, which is widely used in the industry. It can actively monitor any network, and generate audio/email warnings and alerts when any problem is detected. The check types and alert timers are fully customizable.
Another incredible capability of Nagios is that it can monitor both hosts and services, e.g., monitoring IP addresses and TCP/UDP port numbers. To explain a little, let us assume that there is a web server that we want to monitor. Nagios can check whether the server is online by running ping on the IP/name of the server as well as it can be set up to provide warnings in case the round trip time (RTT) to the server increases. Furthermore , Nagios can also check whether TCP port 80 (web server) is reachable e.g., the server is online but Apache/IIS is not responding.
Nagio monitoring can be further extended via remote plugin executor. There are also 3rd party monitoring tools that are based on Nagios, such as Centreon, FAN, op5 Monitor, which supplement standalone Nagios engine in terms of interface, automation, and technical support.
This tutorial explains how to install and configure Nagios on Linux.
Install Nagios on Ubuntu or Debian
On a Debian-based system, the installation in itself is a very simple process thanks to apt-get.
root@mrtg:~# apt-get install nagios3
The mail server setting can be done during Nagios installation. It can also be configured later when needed.
Note: A valid SMTP configuration is needed for Nagios to be able send email notifications.
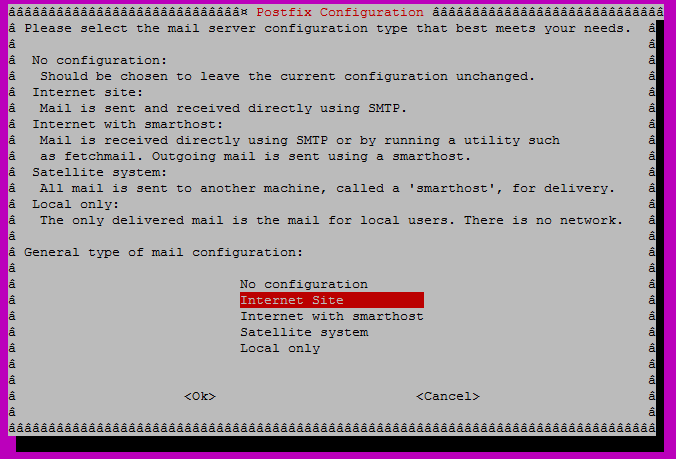
As it can be seen, Nagios supports multiple options for email delivery. The most common options would be Internet Site where the server sends email directly to the recipient. Another widely used option is using smarthost or relay server, in which the server sends the email to an intermediary mail server which in turn is responsible for delivering the mail to the recipient.
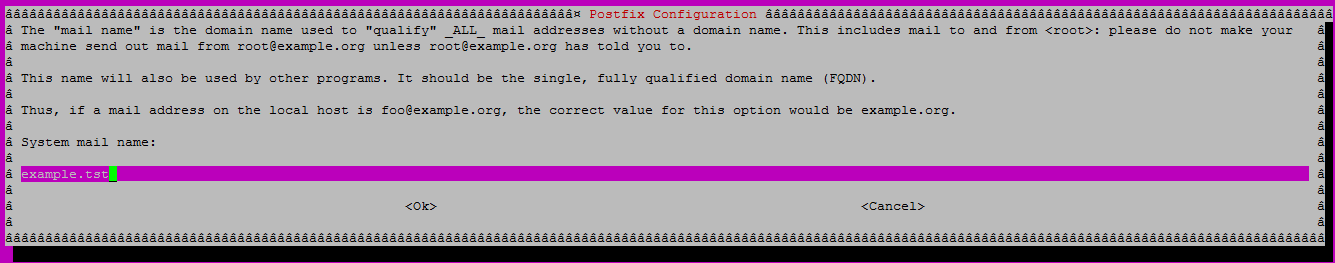
Next, the domain name of the server has to be included in the next step.
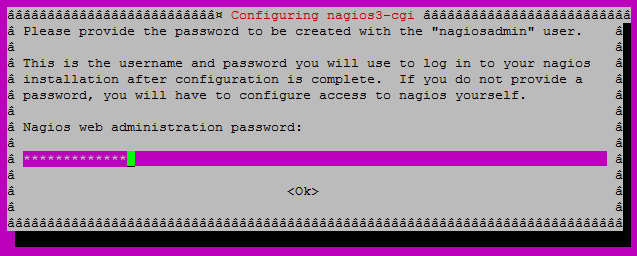
Finally, the password for the Nagios admin user nagiosadmin is set. This value can also be changed later.
Install Nagios on CentOS or RHEL
yum is used for installation. After setting up the repoforge repository, run yum as follows.
root@mrtg:~# yum install nagios nagios-plugins
Requirements for Monitoring
In this tutorial, we assume that we have the following requirements for monitoring.
- All Linux server will be checked every 3 minutes.
- All Cisco Routers will be checked every 3 minutes.
- All email alerts should go to the address [email protected].
- Nagios will verify 3 times before sending out any alerts just to be sure that the problem is real.
- If the RTT to any device exceeds 100 ms and/or packet loss exceeds 20%, email alert will be generated.
The rest of the tutorial will guide you to configure Nagios on Linux.
Nagios Configuration on Ubuntu
It is important to know where Nagios configuration files are located. The following table shows the location of Nagios configuration files on Debian-based systems.
/etc/nagios-plugins |
Customizable scripts used for monitoring |
/etc/nagios3 |
Configuration files to add hosts, services, define checks and timers |
/usr/lib/nagios/plugins |
Executable files used for monitoring |
The following steps are inter-related. Hosts, groups for hosts and adding services to host groups are defined.
Adding Host Template
The templates defining what to do with a type host is defined. We use the files provided with the installation as sample.
First, define a host template for Linux devices.
root@mrtg:~# cd /etc/nagios3/conf.d
root@mrtg:/etc/nagios3/conf.d/# cp generic-host_nagios2.cfg linux-server.cfg
Edit linux-server.cfg as follows. The parts with bold font are modified.
root@mrtg:/etc/nagios3/conf.d/# vim linux-server.cfg
define host{
name                    linux-server
notifications_enabled      1
event_handler_enabled       1
flap_detection_enabled      1
failure_prediction_enabled  1
process_perf_data       1
retain_status_information   1
retain_nonstatus_information    1
check_command     example-host-check ; the script to be used while checking
check_interval                  3        ; the interval between consecutive checks
max_check_attempts              3   ; number of rechecking before generating email alerts
notification_interval           0
notification_period             24x7
notification_options        d,u,r
contact_groups         admins ; the group where emails will be sent
register                        0
        }
Next, define a host template for Cisco devices.
root@mrtg:/etc/nagios3/conf.d/# cp linux-server.cfg cisco-device.cfg
Modify cisco-device.cfg as follows. The bold-font parts are modified.
root@mrtg:/etc/nagios3/conf.d/# vim cisco-device.cfg
# The highlighted parts are modified
define host{
name              cisco-device
notifications_enabled      1
event_handler_enabled       1
flap_detection_enabled      1
failure_prediction_enabled  1
process_perf_data       1
retain_status_information   1
retain_nonstatus_information    1
check_command     example-host-check ; the script to be used while checking
check_interval                3  ; the interval between consecutive checks
max_check_attempts             3 ; number of rechecking before generating email alerts
notification_interval           0
notification_period            24x7
notification_options        d,u,r
contact_groups         admins ; the group where emails will be sent
register                        0
        }
Adding Host
Now that the host template is defined, the actual host to be monitored is added. Again, the files provided by default are used as sample.
root@mrtg:/etc/nagios3/conf.d/# cp   localhost_nagios2.cfg   example.cfg
root@mrtg:/etc/nagios3/conf.d/# vim example.cfg
# Host 1
define host{
use           linux-server        ; Name of host template to use
host_name               our-server        ; The hostname to be used by nagios
alias                   our-server
address                    172.17.1.23     ; The IP address of the host
        }

# Host 2
define host{
use            cisco-device        ; Name of host template to use
host_name         our-router      ; The hostname to be used by nagios
alias                   our-router
address                    172.17.1.1      ; The IP address of the host
        }
Host Group Definition
For ease of management when there are multiple hosts, it is advisable that hosts of similar types are grouped together.
root@mrtg:/etc/nagios3/conf.d/# vim hostgroups_nagios2.cfg
definehostgroup {
hostgroup_name     linux-server       ; the name of the host group
alias            Linux Servers
members            our-server      ; comma separated list of members
        }

definehostgroup {
hostgroup_name       cisco-device    ; the name of the host group
alias           Cisco Devices
members            our-server      ; comma separated list of members
        }
Service Definition
First, the command example-host-check is defined with warning value of 100 ms for latency and 20% for packet loss. Critical values are 5000 ms for latency and 100% packet loss. One IPv4 ping request is transmitted.
root@mrtg:~# vim /etc/nagios-plugins/config/ping.cfg
define command{
        command_name    example-host-check
        command_line    /usr/lib/nagios/plugins/check_ping -H '$HOSTADDRESS$' -w 100,20% -c 5000,100% -p 1 -4
        }
Then, the command is associated with host groups.
root@mrtg:/etc/nagios3/conf.d/# vim services_nagios2.cfg
define service {
hostgroup_name              linux-server
service_description           Linux Servers
check_command                 example-host-check
use                           generic-service
notification_interval 0 ; set > 0 if you want to be renotified
}

define service {
hostgroup_name             cisco-device
service_description        Cisco Devices
check_command                 example-host-check
use                           generic-service
notification_interval 0 ; set > 0 if you want to be renotified
}
Contact Definition
The required address for sending email added to Nagios.
root@mrtg:/etc/nagios3/conf.d/# vim contacts_nagios2.cfg
define contact{
        contact_name                    root
        alias                           Root
        service_notification_period     24x7
        host_notification_period        24x7
        service_notification_options    w,u,c,r
        host_notification_options       d,r
        service_notification_commands   notify-service-by-email
        host_notification_commands      notify-host-by-email
        email                    root@localhost, [email protected]
        }
Finally, a dry run is initiated to check whether there are any configuration errors. If there are no errors, Nagios can be (re)started safely.
root@mrtg:~#nagios –v /etc/nagios3/nagios.cfg
root@mrtg:~# service nagios3 restart
Nagios Configuration on CentOS/RHEL
The following shows the locations of Nagios configuration files on Redhat-based systems.
/etc/nagios/objects |
Configuration files to add hosts, services, define checks and timers |
/usr/lib/nagios/plugins |
Executable files used for monitoring |
Adding Host Template
A template is created to define what needs to be done for a specific type of host. The files provided with the installation is modified.
[root@mrtg objects]# cd /etc/nagios/objects/
[root@mrtg objects]# vim templates.cfg
define host{
   name             linux-server
   use              generic-host
   check_period         24x7
   check_interval     3
   retry_interval     1
   max_check_attempts      3
   check_command      example-host-check
   notification_period           24x7
   notification_interval   0
   notification_options            d,u,r
   contact_groups      admins
   register           0
        }

define host{
   name               cisco-router
   use              generic-host
   check_period         24x7
   check_interval     3
   retry_interval     1
   max_check_attempts      3
   check_command      example-host-check
   notification_period           24x7
   notification_interval   0
   notification_options            d,u,r
   contact_groups      admins
   register           0
        }
Adding Hosts and Host Groups
The configuration file provided with by default is used as a sample. The hosts and host groups are added in the same file.
[root@mrtg objects]# cp localhost.cfg example.cfg
[root@mrtg objects]# vim example.cfg
#Adding Linux server
define host{
use       linux-server
host_name   our-server
alias     our-server
address       172.17.1.23
        }

#Adding Cisco Router
define host{
use     cisco-router
host_name   our-router
alias     our-router
address       172.17.1.1
        }

# HOST GROUP DEFINITION
define hostgroup{
hostgroup_name  linux-servers
alias           Linux Servers
members         our-server
        }

define hostgroup{
hostgroup_name  cisco-router
alias           cisco-router
members         our-router
        }
Service Definition
A service called example-host-check is defined with warning values of 100 ms for latency and 20% for packet loss. The critical values are 5000 ms for latency and 100% for packet loss. Only one IPv4 ping request will be transmitted.
[root@mrtg objects]# vim commands.cfg
define command{
        command_name    example-host-check
        command_line    $USER1$/check_ping -H $HOSTADDRESS$ -w 100.0,20% -c 5000.0,100% -p 1 -4
        }
Contact Definition
The email address where alerts will be sent is added into Nagios.
[root@objects objects]# vim contacts.cfg
define contact{
contact_name    nagiosadmin
use           generic-contact
alias            Nagios Admin
email           nagios@localhost, [email protected]
        }
Finally, we are ready to start the Nagios service. A dry run is recommended to find out errors in configuration.
[root@mrtg ~]# nagios   –v   /etc/nagios/nagios.cfg
[root@mrtg ~]# service nagios restart
[root@mrtg ~]# chkconfig nagios on
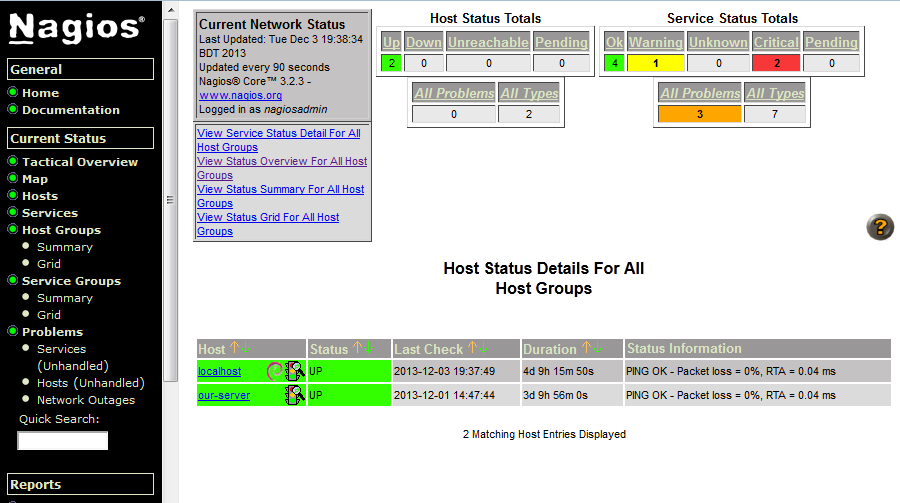
Access Nagios after Configuration
Now you are ready to use Nagios. Nagios can be accessed by opening the URL http://<server-IP-address>/nagios3 in case of Ubuntu/Debian or http://<server-IP-address>/nagios in case of CentOS/RHEL. The user nagiosadmin needs to be authenticated to access the page.
Troubleshooting Nagios
When Nagios is not running the way it is supposed to, the first thing to do would be to initiate a dry run.
On Debian or Ubuntu:
# nagios3 -v /etc/nagios3/nagios.cfg
On CentOS or RHEL:
# nagios -v /etc/nagios/nagios.cfg
The log file may also shed some important clue. The path to the log file is located at /var/log/nagios/nagios.log.
Hope this helps.
Support Xmodulo
This website is made possible by minimal ads and your gracious donation via PayPal or credit card
Please note that this article is published by Xmodulo.com under a Creative Commons Attribution-ShareAlike 3.0 Unported License. If you would like to use the whole or any part of this article, you need to cite this web page at Xmodulo.com as the original source.

Xmodulo © 2021 ‒ About ‒ Write for Us ‒ Feed ‒ Powered by DigitalOcean