How to monitor Linux servers with SNMP and Cacti
Last updated on September 24, 2020 by Sarmed Rahman
SNMP (or Simple Network Management Protocol) is used to gather data on what is going on within a device, such as load, hard disk states, bandwidth. These data are used by network monitoring tools such as Cacti to generate graphs for monitoring purposes.
In a typical deployment of Cacti and SNMP, there will be one or more SNMP-enabled devices, and a separate monitoring server where Cacti collects SNMP feeds from those devices. Please keep in mind that all the devices that need to be monitored must be SNMP enabled. In this tutorial, we will be configuring Cacti and SNMP on the same Linux server for demonstration purpose.
Configure SNMP on Debian or Ubuntu
To install SNMP agent (snmpd) on a Debian-based system, run the following command.
root@server:~# apt-get install snmpd
Then edit its configuration like the following.
root@server:~# vim /etc/snmp/snmpd.conf
# this will make snmpd listen on all interfaces
agentAddress  udp:161

# a read only community 'myCommunity' and the source network is defined
rocommunity myCommunity 172.17.1.0/24

sysLocation    Earth
sysContact     [email protected]
After editing the config file, restart snmpd.
root@server:~# service snmpd restart
Configure SNMP on CentOS or RHEL
To install SNMP tools and libraries, run the following command.
root@server:~# sudo yum install net-snmp
Then edit an SNMP config file like the following.
root@server:~# vim /etc/snmp/snmpd.conf
# A user 'myUser' is being defined with the community string 'myCommunity' and source network 172.17.1.0/24
com2sec myUser 172.17.1.0/24 myCommunity

# myUser is added into the group 'myGroup' and the permission of the group is defined
group    myGroup    v1        myUser
group    myGroup    v2c        myUser
view all included .1
access myGroup    ""    any    noauth     exact    all    all    none
root@server:~# service snmpd restart
root@server:~# chkconfig snmpd on
Restart snmpd service, and add it to startup service list.
Testing SNMP
SNMP can be tested by running the snmpwalk command. If SNMP has been successfully configured, this command will generate a ton of output.
root@server:~# snmpwalk -c myCommunity 172.17.1.44 -v1
iso.3.6.1.2.1.1.1.0 = STRING: "Linux mrtg 3.5.0-17-generic #28-Ubuntu SMP Tue Oct 9 19:31:23 UTC 2012 x86_64"
iso.3.6.1.2.1.1.2.0 = OID: iso.3.6.1.4.1.8072.3.2.10
iso.3.6.1.2.1.1.3.0 = Timeticks: (2097) 0:00:20.97

~~ OUTPUT TRUNCATED ~~

iso.3.6.1.2.1.92.1.1.2.0 = Gauge32: 1440
iso.3.6.1.2.1.92.1.2.1.0 = Counter32: 1
iso.3.6.1.2.1.92.1.2.2.0 = Counter32: 0
iso.3.6.1.2.1.92.1.3.1.1.2.7.100.101.102.97.117.108.116.1 = Timeticks: (1) 0:00:00.01
iso.3.6.1.2.1.92.1.3.1.1.3.7.100.101.102.97.117.108.116.1 = Hex-STRING: 07 DD 0B 12 00 39 27 00 2B 06 00
Configure Cacti with SNMP
In this tutorial, we are setting up both Cacti and SNMP on the same Linux server. So go ahead and install Cacti on your Linux server on which SNMP was just configured.
After installation, Cacti web interface can be accessed at http://172.17.1.44/cacti, of course, in your case, the IP address of your server.


The paths during Cacti installation are usually correct. But they can be double checked if necessary.

During the first-time installation, the default username and password for Cacti are admin and admin. You will be forced to change the password after first login.

Add and Manage Devices to Cacti
Cacti will poll devices based on SNMP string that was configured earlier. In this tutorial, we will add only the local server where SNMP is already enabled.
To add devices, we login as admin and go to console in the Cacti admin panel. We click Console > Devices.

There may already be a device named localhost. We do not need it as we will create fresh graphs. We can delete this device from the list. We add a new device by using the add button.

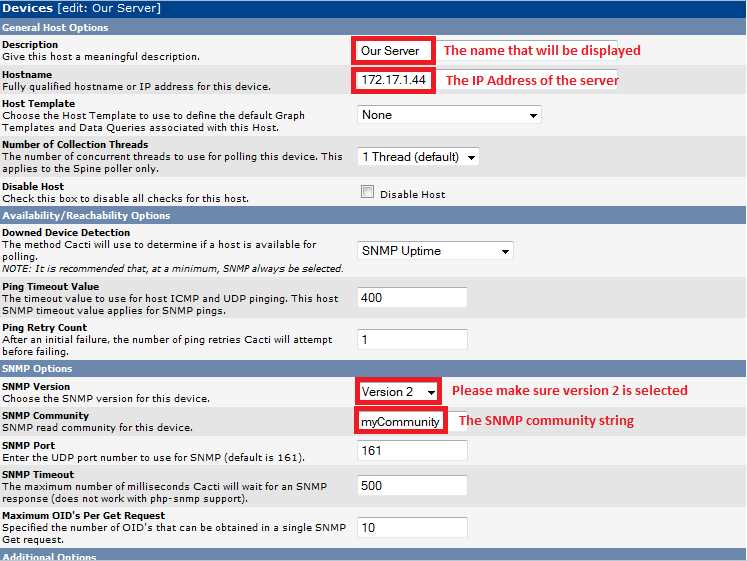
Next, we set the device parameters.

Now that the device has been added, we specify the graph templates that we want to create. This section can be found in the bottom section of the page.

And then we proceed to creating the graphs.

Here, we create graphs for load average, RAM and hard disk, processor.

Interface Graphs and 64-bit Counters
By default, Cacti uses 32-bit counters in SNMP queries. 32-bit counters are sufficient for most bandwidth graphs, but they do not work correctly for graphs greater than 100 Mbps. If it is known that the bandwidth will exceed more than 100 Mbps, it is always advisable to use 64-bit counters. Using 64-bit counters is not hard at all.

Note: It takes around 15 minutes for Cacti to populate new graphs. There are not alternatives to being patient.
Creating Graph Trees
These snapshots illustrate how to create graph trees and how to add graph to those trees.


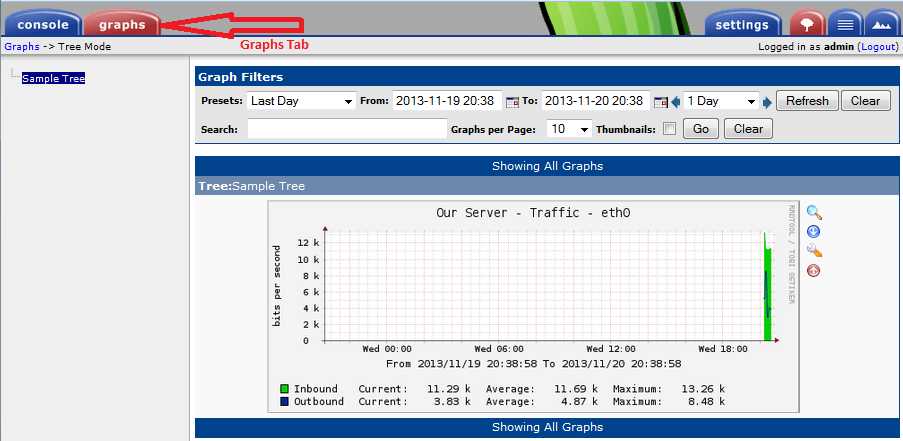
We can verify the graph in the graph tree.

User Management
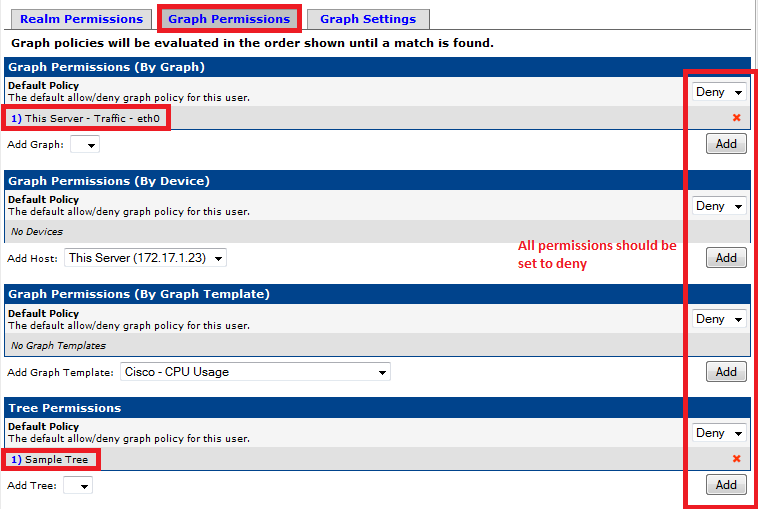
Finally, we create a user with view permission to only the graph that we have created. Cacti has built in user management system, and it is highly customizable.


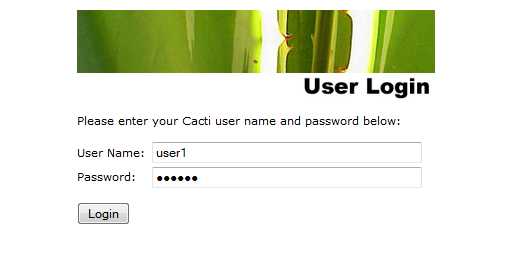
After completing these steps, we can log in with the user user1 and verify that only this user is able to view the graph.


In this tutorial, we have deployed a Cacti server in the network monitoring system, which then collects SNMP feeds from SNMP-enabled devices. Cacti servers are stable, and can deal with a variety of graphs. However, here the SNMP data feed is not protected with authentication and encryption. For stronger security, you should consider using SNMP v3 which comes with advanced security features.
Hope this helps.
Support Xmodulo
This website is made possible by minimal ads and your gracious donation via PayPal or credit card
Please note that this article is published by Xmodulo.com under a Creative Commons Attribution-ShareAlike 3.0 Unported License. If you would like to use the whole or any part of this article, you need to cite this web page at Xmodulo.com as the original source.
Xmodulo © 2021 ‒ About ‒ Write for Us ‒ Feed ‒ Powered by DigitalOcean

