How to monitor a log file on Linux with logwatch
Last updated on October 20, 2020 by Gabriel Cánepa
Linux operating system and many applications create special files commonly referred to as logs to record their operational events. These system logs or application-specific log files are an essential tool when it comes to understanding and troubleshooting the behavior of the operating system and third-party applications. However, log files are not precisely what you would call light or easy reading, and analyzing raw log files by hand is often time-consuming and tedious. For that reason, any utility that can convert raw log files into a more user-friendly log digest is a great boon for sysadmins.
logwatch is an open-source log parser and analyzer written in Perl, which can parse and convert raw log files into a structured format, making a customizable report based on your use cases and requirements. In logwatch, the focus is on producing more easily consumable log summary, not on real-time log processing and monitoring. As such, logwatch is typically invoked as an automated cron task with desired time and frequency, or manually from the command line whenever log processing is needed. Once a log report is generated, logwatch can email the report to you, save it to a file, or display it on the screen.
A logwatch report is fully customizable in terms of verbosity and processing coverage. The log processing engine of logwatch is extensible, in a sense that if you want to enable logwatch for a new application, you can write a log processing script (in Perl) for the application's log file, and plug it under logwatch.
One downside of logwatch is that it does not include in its report detailed timestamp information available in original log files. You will only know that a particular event was logged in a requested range of time, and you will have to access original log files to get exact timing information.
Installing logwatch on Linux
On Debian and derivatives (Ubuntu, Debian, Linux Mint):
# aptitude install logwatch
On Red Hat-based distributions (CentOS, Fedora, RHEL):
# yum install logwatch
Configuring logwatch
During installation, the main configuration file (logwatch.conf) is placed in /etc/logwatch/conf. Configuration options defined in this file override system-wide settings defined in /usr/share/logwatch/default.conf/logwatch.conf.
If logwatch is launched from the command line without any arguments, the custom options defined in /etc/logwatch/conf/logwatch.conf will be used. However, if any command-line arguments are specified with logwatch command, those arguments in turn override any default/custom settings in /etc/logwatch/conf/logwatch.conf.
In this article, we will customize several default settings of logwatch by editing /etc/logwatch/conf/logwatch.conf file.
Detail = <Low, Med, High, or a number>
Detail directive controls the verbosity of a logwatch report. It can be a positive integer, or High, Med, Low, which correspond to 10, 5, and 0, respectively.
MailTo = [email protected]
MailTo directive is used if you want to have a logwatch report emailed to you. To send a logwatch report to multiple recipients, you can specify their email addresses separated with a space. To be able to use this directive, however, you will need to configure a local mail transfer agent (MTA) such as sendmail or Postfix on the server where logwatch is running.
Range = <Yesterday|Today|All>
Range directive specifies the time duration of a logwatch report. Common values for this directive are Yesterday, Today or All. When Range = All is used, Archive = yes directive is also needed, so that all archived versions of a given log file (e.g., /var/log/maillog, /var/log/maillog.X, or /var/log/maillog.X.gz) are processed.
Besides such common range values, you can also use more complex range options such as the following.
- Range = "2 hours ago for that hour"
- Range = "-5 days"
- Range = "between -7 days and -3 days"
- Range = "since September 15, 2014"
- Range = "first Friday in October"
- Range = "2014/10/15 12:50:15 for that second"
To be able to use such free-form range examples, you need to install Date::Manip Perl module from CPAN. Refer to this post for CPAN module installation instructions.
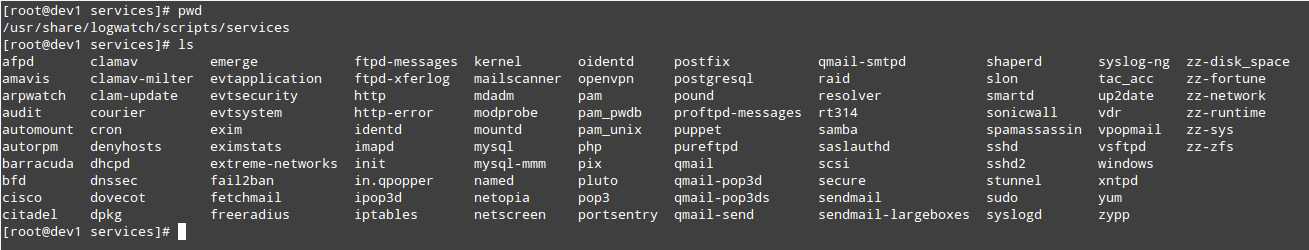
Service = <service-name-1>
Service = <service-name-2>
. . .
Service option specifies one or more services to monitor using logwath. All available services are listed in /usr/share/logwatch/scripts/services, which cover essential system services (e.g., pam, secure, iptables, syslogd), as well as popular application services such as sudo, sshd, http, fail2ban, samba. If you want to add a new service to the list, you will have to write a corresponding log processing Perl script, and place it in this directory.
If this option is used to select specific services, you need to comment out the line Service = All in /usr/share/logwatch/default.conf/logwatch.conf.
Format = <text|html>
Format directive specifies the format (e.g., text or HTML) of a logwatch report.
Output = <file|mail|stdout>
Output directive indicates where a logwatch report should be sent. It can be saved to a file (file), emailed (mail), or shown to screen (stdout).
Analyzing Log Files with logwatch
To understand how to analyze log files using logwatch, consider the following logwatch.conf example:
Detail = High
MailTo = [email protected]
Range = Today
Service = http
Service = postfix
Service = zz-disk_space
Format = html
Output = mail
Under these settings, logwatch will process log files generated by three services (http, postfix and zz-disk_space) today, produce an HTML report with high verbosity, and email it to you.
If you do not want to customize /etc/logwatch/conf/logwatch.conf, you can leave the default configuration file unchanged, and instead run logwatch from the command line as follows. It will achieve the same outcome.
# logwatch --detail 10 --mailto [email protected] --range today --service http --service postfix --service zz-disk_space --format html --output mail
The emailed report looks like the following.
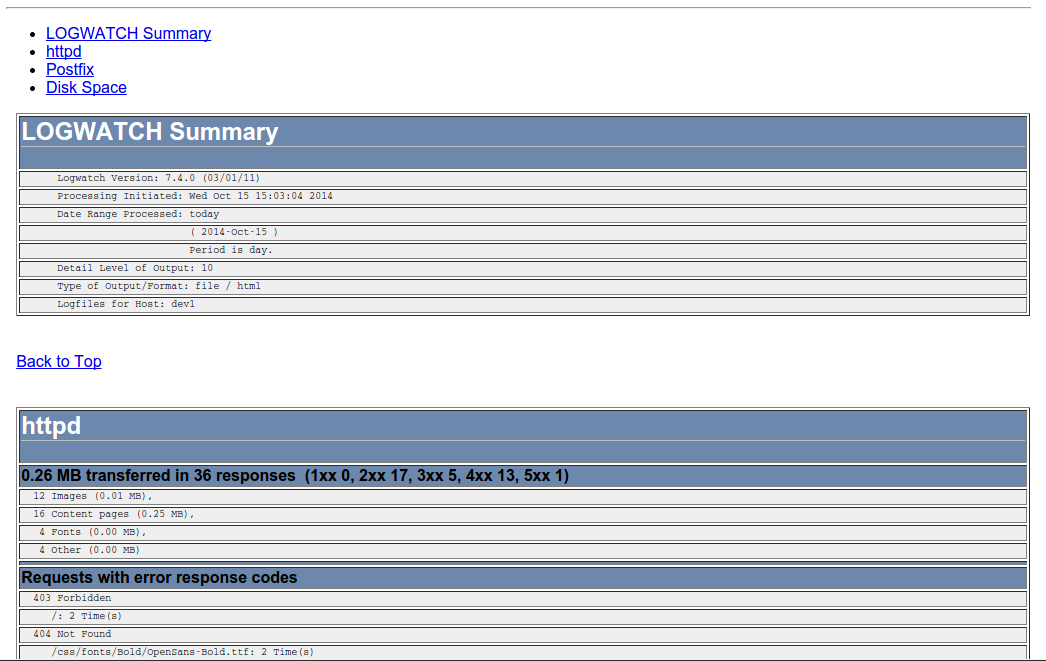
The email header includes links to navigate the report sections, one per each selected service, and also Back to top links.
You will want to use the email report option when the list of recipients is small. Otherwise, you can have logwatch save a generated HTML report within a network share that can be accessed by all the individuals who need to see the report. To do so, make the following modifications in our previous example:
Detail = High
Range = Today
Service = http
Service = postfix
Service = zz-disk_space
Format = html
Output = file
Filename = /var/www/html/logs/dev1.html
Equivalently, run logwatch from the command line as follows.
# logwatch --detail 10 --range today --service http --service postfix --service zz-disk_space --format html --output file --filename /var/www/html/logs/dev1.html
Finally, let's configure logwatch to be executed by cron on your desired schedules. The following example will run a logwatch cron job every business day at 12:15 pm:
# crontab -e
15 12 * * 1,2,3,4,5 /sbin/logwatch
Hope this helps. Feel free to comment to share your own tips and ideas with the community!
Support Xmodulo
This website is made possible by minimal ads and your gracious donation via PayPal or credit card
Please note that this article is published by Xmodulo.com under a Creative Commons Attribution-ShareAlike 3.0 Unported License. If you would like to use the whole or any part of this article, you need to cite this web page at Xmodulo.com as the original source.

Xmodulo © 2021 ‒ About ‒ Write for Us ‒ Feed ‒ Powered by DigitalOcean