How to monitor Nginx web server from the command line in real time
Last updated on September 30, 2020 by Dan Nanni
Once Nginx web server is up and running in a production environment, you will want to monitor its activity in real time. In fact, general network monitoring software such as Nagios, Zabbix, Munin provide support for real-time Nginx monitoring.
However, if you do not need comprehensive reporting capabilities or long-term statistics offered by such tools, but just want a quick and easy way to monitor the requests coming to an Nginx web server, I would recommend quick and easy command line tools. One such option for monitoring Nginx is ngxtop.
You will immediately tell that ngxtop (both its name and interface) is inspired by the famous top command. What ngxtop does is to parse Nginx access log file (and others such as Apache2 log), and display analyzed results via top-like interface in real-time. You can tout your sophisticated monitoring tool all you want, but it cannot beat ngxtop's simplicity, and simplicity is not something that cannot be dismissed.
In this tutorial, I will describe how to monitor Nginx web server in real time with ngxtop.
Install ngxtop on Linux
First, install pip on your Linux system as a prerequisite for ngxtop.
Then install ngxtop as follows.
$ sudo pip install ngxtop
Usage of ngxtop
The basic usage of ngxtop is as follows.
ngxtop [options]
ngxtop [options] (print|top|avg|sum) <var>
ngxtop info
Here are some of the common options.
-l <file>: the full path to an access log file (Nginx or Apache2)-f <format>: access log format--no-follow: process the current log file snapshot, instead of new lines as they are written to the log file in real time-t <seconds>: update interval-n <number>: the number of lines in the display-o <var>: ordering criteria (default: count)-a <exp> ..., --a <exp> ...: add exp (must be aggregation exp: sum, avg, min, max, etc.) into output-v: verbose output-i <filter-expression>: only process records matched with filter
Here are built-in variables (represented as <var> in the above). Their meanings are self-explanatory.
- body_bytes_send
- http_referer
- http_user_agent
- remote_addr
- remote_user
- request
- status
- time_local
Monitor Nginx with ngxtop
By default, ngxtop will try to detect the location of Nginx access log from its config file (/etc/nginx/nginx.conf). Thus, to monitor Nginx, simply run:
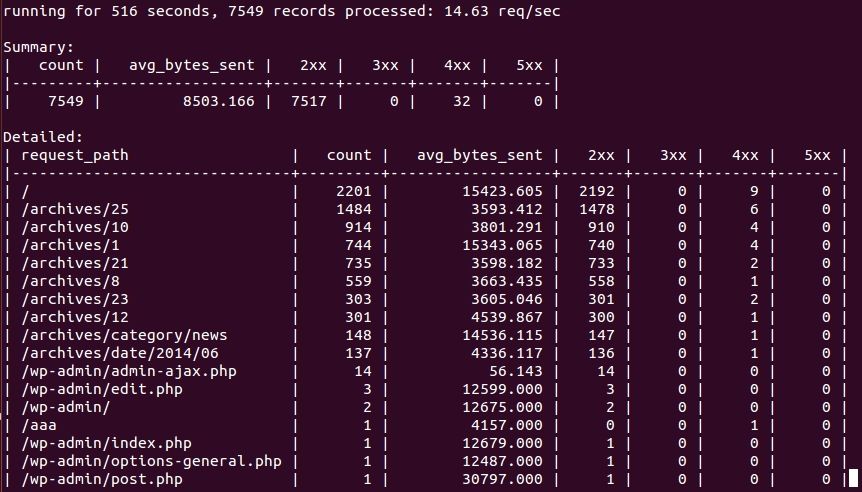
$ ngxtop
It will display 10 requests served by Nginx, sorted by the number of requests.
To display top-20 most frequent requests:
$ ngxtop -n 20
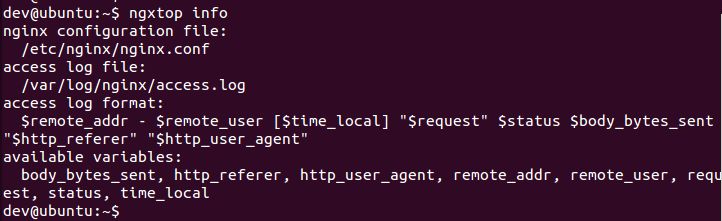
To get information about Nginx (including available variable info):
$ ngxtop info
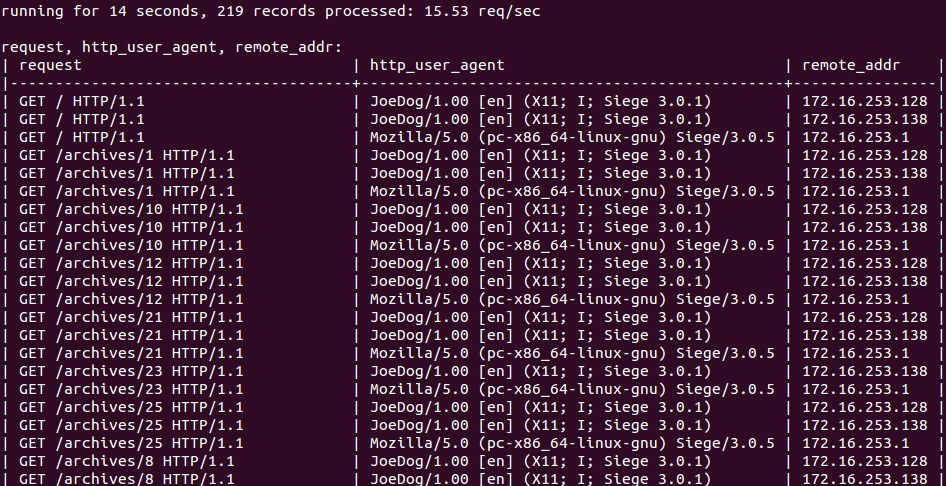
If you want, you can customize the variables to display. For that, simply list variables you are interested in. print command will display individual requests.
$ ngxtop print request http_user_agent remote_addr
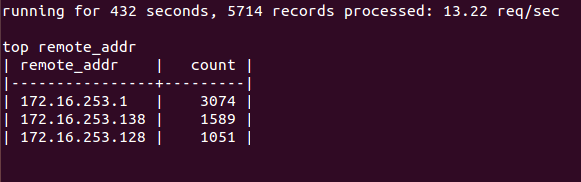
To display top IP addresses of clients:
$ ngxtop top remote_addr
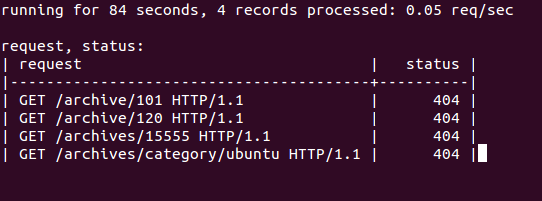
To display requests whose status code is 404:
$ ngxtop -i 'status == 404' print request status
Besides Nginx, ngxtop is capable of processing other log files, such as Apache access logs. To monitor Apache web server, use this command:
$ tail -f /var/log/apache2/access.log | ngxtop -f common
Support Xmodulo
This website is made possible by minimal ads and your gracious donation via PayPal or credit card
Please note that this article is published by Xmodulo.com under a Creative Commons Attribution-ShareAlike 3.0 Unported License. If you would like to use the whole or any part of this article, you need to cite this web page at Xmodulo.com as the original source.

Xmodulo © 2021 ‒ About ‒ Write for Us ‒ Feed ‒ Powered by DigitalOcean