How to monitor and troubleshoot a Linux server using sysdig
Last updated on November 26, 2020 by Gabriel Cánepa
What is the first thing that comes to mind when you need to track system calls made and received by a process? You'll probably think of strace, and you are right. What tool would you use to monitor raw network traffic from the command line? If you thought about tcpdump, you made an excellent choice again. And if you ever run into the need to having to keep track of open files (in the Unix sense of the word: everything is a file), chances are you'll use lsof.
strace, tcpdump and lsof are all indeed great utilities that should be part of every sysadmin's toolset, and that is precisely the reason why you will love sysdig, a powerful open source tool for system-level exploration and troubleshooting, introduced by its creators as "strace + tcpdump + lsof + awesome sauce with a little Lua cherry on top." Humor aside, one of the great features of sysdig resides in its ability not only to analyze the live state of a Linux system, but also to save the state in a dump file for offline inspection. What's more, you can customize sysdig's behavior or even enhance its capabilities by using built-in (or writing your own) small scripts called chisels. Individual chisels are used to analyze sysdig-captured event streams in various script-specific fashions.
In this tutorial we'll explore the installation and basic usage of sysdig to perform system monitoring and troubleshooting on Linux.
Install sysdig on Linux
For this tutorial, we will choose to use the automatic installation process described in the official website for the sake of simplicity, brevity, and distribution agnosticity. In the automatic process, the installation script automatically detects the operating system and installs all the necessary dependencies.
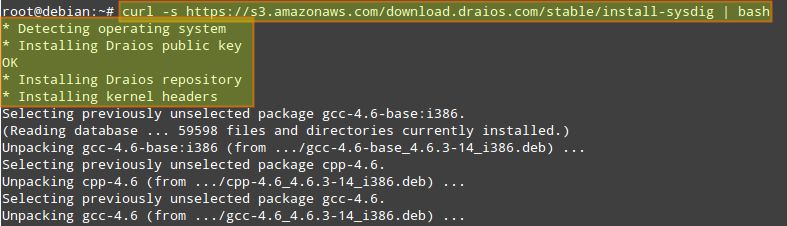
Run the following command as root to install sysdig from the official apt/yum repository:
# curl -s https://s3.amazonaws.com/download.draios.com/stable/install-sysdig | bash
Once the installation is complete, we can invoke sysdig as follows to get a feel for it:
# sysdig
Our screen will be immediately filled with all that is going on in our system, not allowing us to do much more with that information. For that reason, we will run:
# sysdig -cl | less
to see a list of available chisels.

The following categories are available by default, each of which is populated by multiple built-in chisels.
- CPU Usage
- Errors
- I/O
- Logs
- Misc
- Net
- Performance
- Security
- System State
To display information (including detailed command-line usage) on a particular chisel, run:
# sysdig -cl [chisel_name]
For example, we can check information about spy_port chisel under Net category by running:
# sysdig -i spy_port

Chisels can be combined with filters (which can be applied to both live data or a trace file) to obtain more useful output.
Filters follow a class.field structure. For example:
- fd.cip: client IP address.
- evt.dir: event direction can be either
>for enter events or<for exit events.
The complete filter list can be displayed with:
# sysdig -l
In the rest of the tutorial, I will demonstrate several use cases of sysdig.
Sysdig Example: Troubleshooting Server Performance
Suppose your server is experiencing performance issues (e.g., unresponsiveness or significant delays in responding). You can use the bottlenecks chisel to display a list of the 10 slowest systems calls at the moment.
Use the following command to check up on a live server in real time. The -c flag followed by a chisel name tells sysdig to run the specified chisel.
# sysdig -c bottlenecks
Alternatively, you can conduct a server performance analysis offline. In that case, you can save a complete sysdig trace to a file, and run the bottlenecks chisel against the trace as follows.
First, save a sysdig trace (use Ctrl+c to stop the collection):
# sysdig -w trace.scap
Once the trace is collected, you can check the slowest systems calls that were performed during the capture interval by running:
# sysdig -r trace.scap -c bottlenecks
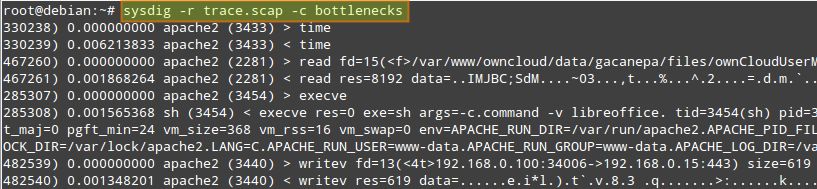
You want to pay attention fo columns #2, #3, and #4, which indicate execution time, process name, and PID, respectively.
Sysdig Example: Monitoring Interactive User Activities
Suppose you as a sysadmin want to monitor interactive user activities in a system (e.g., what command a user typed from the command line, and what directories the user went to). That is when spy_user chisel comes in handy.
Let's first collect a sysdig trace with a couple of extra options.
# sysdig -s 4096 -z -w /mnt/sysdig/$(hostname).scap.gz
-s 4096tellssysdigto capture up to 4096 bytes of each event.-z(used with-w) enables compression for a trace file.-w <trace-file>savessysdigtraces to a specified file.
In the above, we customize the name of the compressed trace file on a per-host basis. Remember that you can interrupt the execution of sysdig at any moment by pressing Ctrl+c.
Once we've collected a reasonable amount of data, we can view interactive activities of every user in a system by running:
# sysdig -r /mnt/sysdig/debian.scap.gz -c spy_users
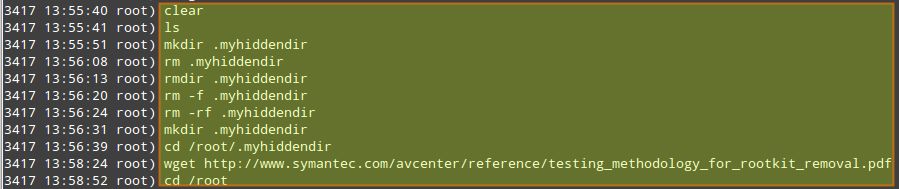
The first column in the above output indicates the PID of the process associated with a given user's activity.
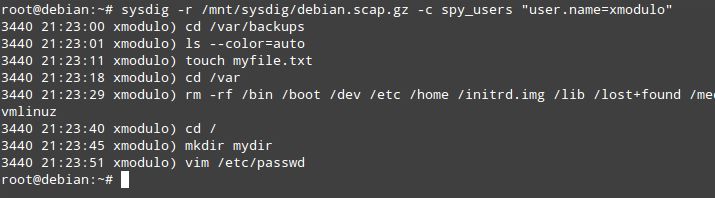
What if you want to target a specific user, and monitor the user's activities only? You can filter the results of the spy_users chisel by username:
# sysdig -r /mnt/sysdig/debian.scap.gz -c spy_users "user.name=xmodulo"
Sysdig Example: Monitoring File I/O
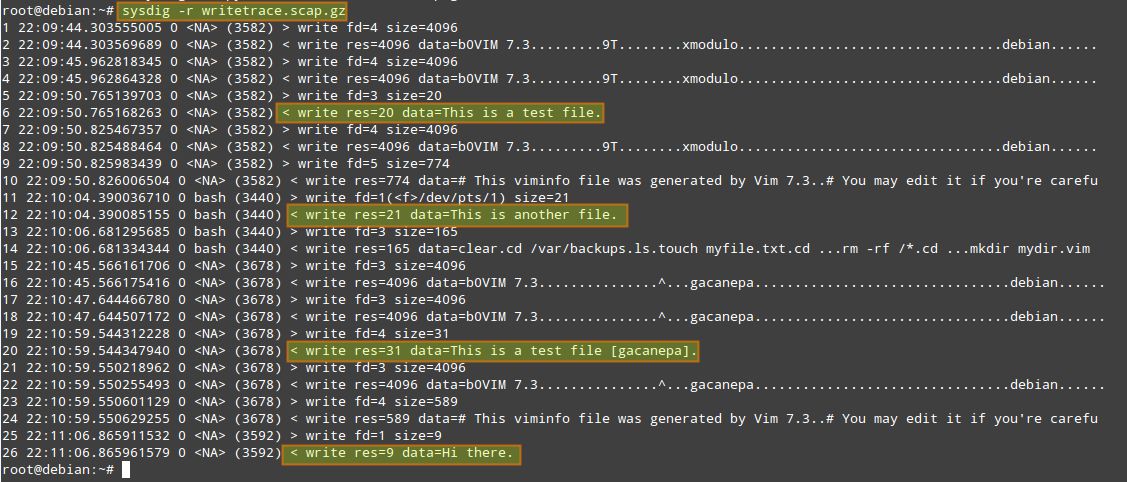
We can customize the output format of sysdig traces with -p flag, and indicate desired fields (e.g., user name, process name, and file or socket name) enclosed inside double quotes. In this example, we will create a trace file that will only contain writing events in home directories (which we can inspect later with sysdig -r writetrace.scap.gz).
# sysdig -p "%user.name %proc.name %fd.name" "evt.type=write and fd.name contains /home/" -z -w writetrace.scap.gz
Sysdig Example: Monitoring Network I/O
As part of server troubleshooting, you may want to snoop on network traffic, which is typically done with tcpdump. With sysdig, traffic sniffing can be done as easily, but in more user friendly fashions.
For example, you can inspect data (in ASCII) that has been exchanged with a particular IP address, served by a particular process (e.g., apache2):
# sysdig -s 4096 -A -c echo_fds fd.cip=192.168.0.100 -r /mnt/sysdig/debian.scap.gz proc.name=apache2
If you want to monitor raw data transfer (in binary) instead, replace -A with -X:
# sysdig -s 4096 -X -c echo_fds fd.cip=192.168.0.100 -r /mnt/sysdig/debian.scap.gz proc.name=apache2
For more information, examples, and case studies, you can check out the project website. Believe me, the possibilities are limitless. But don't just take my word for it. Install sysdig and start digging today!
Support Xmodulo
This website is made possible by minimal ads and your gracious donation via PayPal or credit card
Please note that this article is published by Xmodulo.com under a Creative Commons Attribution-ShareAlike 3.0 Unported License. If you would like to use the whole or any part of this article, you need to cite this web page at Xmodulo.com as the original source.

Xmodulo © 2021 ‒ About ‒ Write for Us ‒ Feed ‒ Powered by DigitalOcean