How to sniff HTTP traffic from the command line on Linux
Last updated on October 12, 2020 by Dan Nanni
Suppose you want to sniff live HTTP web traffic (i.e., HTTP requests and responses) on the wire for some reason. For example, you may be testing experimental features of a web server. Or you may be debugging a web application or a RESTful service. Or you may be trying to troubleshoot PAC (proxy auto config) or check for any malware files surreptitiously downloaded from a website. Whatever the reason is, there are cases where HTTP traffic sniffing is helpful, for system admins, developers, or even end users.
While packet sniffing tools such as tcpdump are popularly used for live packet dump, you need to set up proper filtering to capture only HTTP traffic, and even then, their raw output typically cannot be interpreted at the HTTP protocol level so easily. Real-time web server log parsers such as ngxtop provide human-readable real-time web traffic traces, but only applicable with a full access to live web server logs.
What will be nice is to have tcpdump-like sniffing tool, but targeting HTTP traffic only. In fact, httpry is extactly that: HTTP packet sniffing tool. httpry captures live HTTP packets on the wire, and displays their content at the HTTP protocol level in a human-readable format. In this tutorial, let's see how we can sniff HTTP traffic with httpry.
Install httpry on Linux
Install httpry on Ubuntu or Debian
On Debian-based systems, httpry is not available in base repositories. So build it from the source:
$ sudo apt-get install gcc make git libpcap0.8-dev
$ git clone https://github.com/jbittel/httpry.git
$ cd httpry
$ make
$ sudo make install
Install httpry on CentOS or RHEL
First, enable EPEL repo, and then use yum command:
$ sudo yum install httpry
Install httpry on Fedora
On Fedora, simply run:
$ sudo yum install httpry
Build httpry on RPM-based Linux
You can easily build httpry from the source by:
$ sudo yum install gcc make git libpcap-devel
$ git clone https://github.com/jbittel/httpry.git
$ cd httpry
$ make
$ sudo make install
Basic Usage of httpry
The basic use case of httpry is as follows.
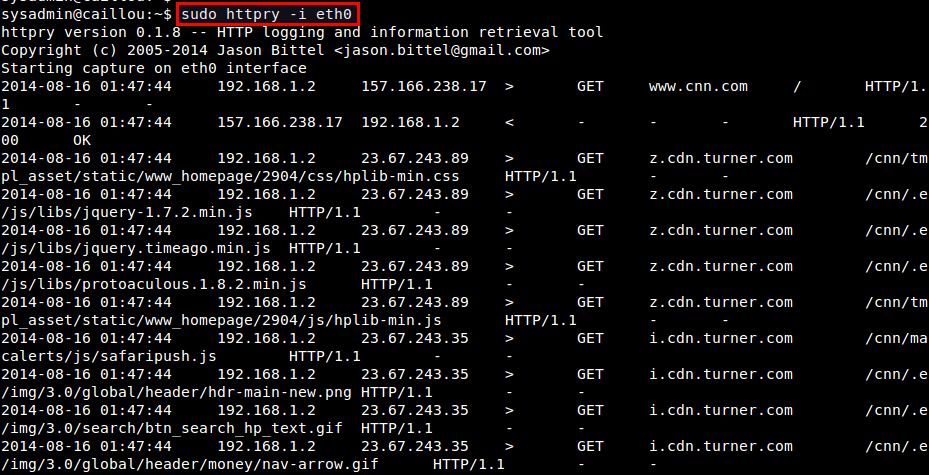
$ sudo httpry -i <network-interface>
httpry then listens on a specified network interface, and displays captured HTTP requests/responses in real time.

In most cases, however, you will be swamped with the fast scrolling output as packets are coming in and out. So you want to save captured HTTP packets for offline analysis. For that, use either -b or -o options. The -b option allows you to save raw HTTP packets into a binary file as is, which then can be replayed with httpry later. On the other hand, -o option saves human-readable output of httpry into a text file.
To save raw HTTP packets into a binary file:
$ sudo httpry -i eth0 -b output.dump
To replay saved HTTP packets:
$ httpry -r output.dump
Note that when you read a dump file with -r option, you don't need root privilege.
To save httpry's output to a text file:
$ sudo httpry -i eth0 -o output.txt
Advanced Usage of httpry
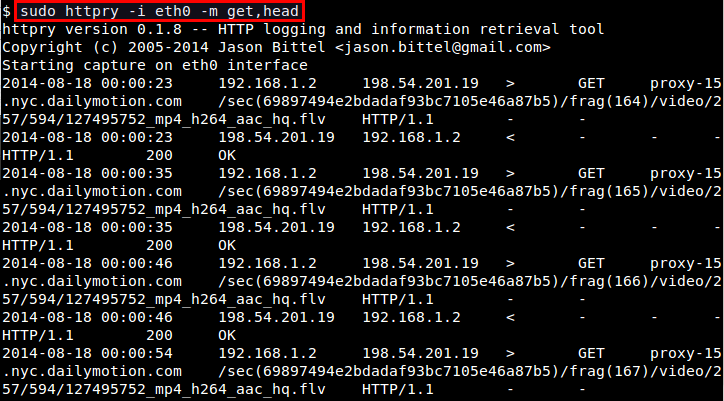
If you want to monitor only specific HTTP methods (e.g., GET, POST, PUT, HEAD, CONNECT, etc), use -m option:
$ sudo httpry -i eth0 -m get,head

If you downloaded httpry's source code, you will notice that the source code comes with a collection of Perl scripts which aid in analyzing httpry's output. These scripts are found in httpry/scripts/plugins directory. If you want to write a custom parser for httpry's output, these scripts can be good examples to start from. Some of their capabilities are:
hostnames: Display a list of unique host names with counts.find_proxies: Detect web proxies.search_terms: Find and count search terms entered in search services.content_analysis: Find URIs which contain specific keywords.xml_output: Convert output into XML format.log_summary: Generate a summary of log.db_dump: Dump log file data into a MySQL database.
Before using these scripts, first run httpry with -o option for some time. Once you obtained the output file, run the scripts on it at once by using this command:
$ cd httpry/scripts
$ perl parse_log.pl -d ./plugins <httpry-output-file>
You may encounter warnings with several plugins. For example, db_dump plugin may fail if you haven't set up a MySQL database with DBI interface. If a plugin fails to initialize, it will automatically be disabled. So you can ignore those warnings.
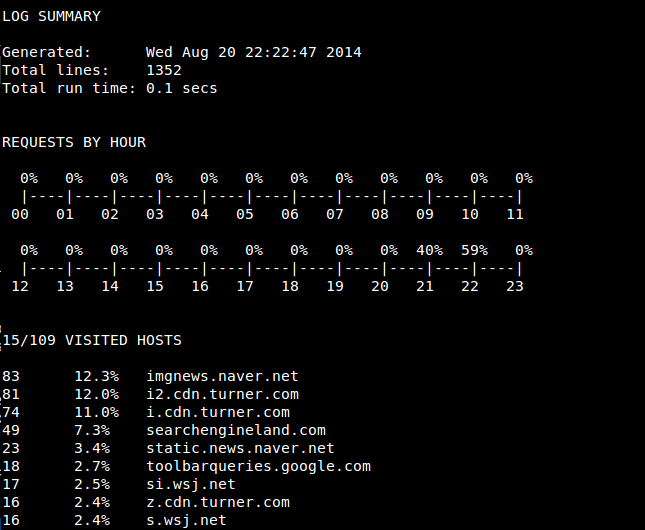
After parse_log.pl is completed, you will see a number of analysis results (*.txt/xml) in httpry/scripts directory. For example, log_summary.txt looks like the following.

To conclude, httpry can be a life saver if you are in a situation where you need to interpret live HTTP packets. That might not be so common for average Linux users, but it never hurts to be prepared. What do you think of this tool?
Support Xmodulo
This website is made possible by minimal ads and your gracious donation via PayPal or credit card
Please note that this article is published by Xmodulo.com under a Creative Commons Attribution-ShareAlike 3.0 Unported License. If you would like to use the whole or any part of this article, you need to cite this web page at Xmodulo.com as the original source.
Xmodulo © 2021 ‒ About ‒ Write for Us ‒ Feed ‒ Powered by DigitalOcean

