What are useful command-line network monitors on Linux
Last updated on December 3, 2020 by Dan Nanni
Network monitoring is a critical IT function for businesses of all sizes. The goal of network monitoring can vary. For example, the monitoring activity can be part of long-term network provisioning, security protection, performance troubleshooting, network usage accounting, and so on. Depending on its goal, network monitoring is done in many different ways, such as performing packet-level sniffing, collecting flow-level statistics, actively injecting probes into the network, parsing server logs, etc.
While there are many dedicated network monitoring systems capable of 24/7/365 monitoring, you can also leverage command-line network monitors in certain situations, where a dedicated monitor is an overkill. If you are a system admin, you are expected to have hands-on experience with some of well known CLI network monitors. Here is a list of popular and useful command-line network monitors on Linux.
Packet-Level Sniffing
In this category, monitoring tools capture individual packets on the wire, dissect their content, and display decoded packet content or packet-level statistics. These tools conduct network monitoring from the lowest level, and as such, can possibly do the most fine-grained monitoring at the cost of network I/O and analysis efforts.
1. dhcpdump
A comman-line DHCP traffic sniffer capturing DHCP request/response traffic, and displays dissected DHCP protocol messages in a human-friendly format. It is useful when you are troubleshooting DHCP related issues.
2. dsniff
A collection of command-line based sniffing, spoofing and hijacking tools designed for network auditing and penetration testing. They can sniff various information such as passwords, NSF traffic, email messages, website URLs, and so on.
3. httpry
An HTTP packet sniffer which captures and decode HTTP requests and response packets, and display them in a human-readable format.
4. IPTraf
A console-based network statistics viewer. It displays packet-level, connection-level, interface-level, protocol-level packet/byte counters in real-time. Packet capturing can be controlled by protocol filters, and its operation is full menu-driven.

5. mysql-sniffer
A MySQL traffic sniffer which captures and decodes packets associated with MySQL queries. It displays the most frequent or all queries in a human-readable format.
6. ngrep
grep over network packets. It can capture live packets, and match (filtered) packets against regular expressions or hexadecimal expressions. It is useful for detecting and storing any anomalous traffic, or for sniffing particular patterns of information from live traffic.
7. p0f
A passive fingerprinting tool which, based on packet sniffing, reliably identifies operating systems, NAT or proxy settings, network link types and various other properites associated with an active TCP connection.
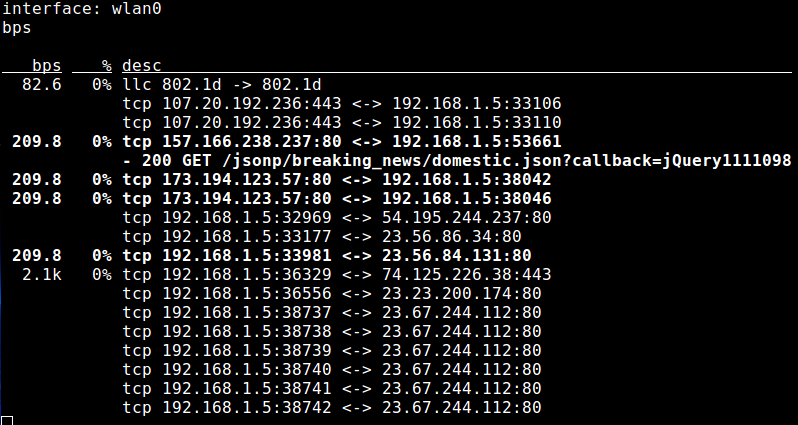
8. pktstat
A command-line tool which analyzes live packets to display connection-level bandwidth usages as well as descriptive information of protocols involved (e.g., HTTP GET/POST, FTP, X11).
9. Snort
An intrusion detection and prevention tool which can detect/prevent a variety of backdoor, botnets, phishing, spyware attacks from live traffic based on rule-driven protocol analysis and content matching.
10. tcpdump
An command-line packet sniffer which is capable of capturing nework packets on the wire based on filter expressions, dissect a wide range of protocols associated with the packets, and dump the packet content for packet-level analysis. It is widely used for any kinds of networking related troubleshooting, network application debugging, or security monitoring.
11. tshark
A command-line packet sniffing tool that comes with Wireshark GUI-based protocol analyzer. It can capture and decode live packets on the wire, and show decoded packet content in a human-friendly fashion.
Flow-/Process-/Interface-Level Monitoring
In this category, network monitoring is done by classifying network traffic into flows, associated processes or interfaces, and collecting per-flow, per-process or per-interface statistics. Source of information can be libpcap packet capture library or sysfs kernel virtual filesystem. Monitoring overhead of these tools is low, but packet-level inspection capabilities are missing.
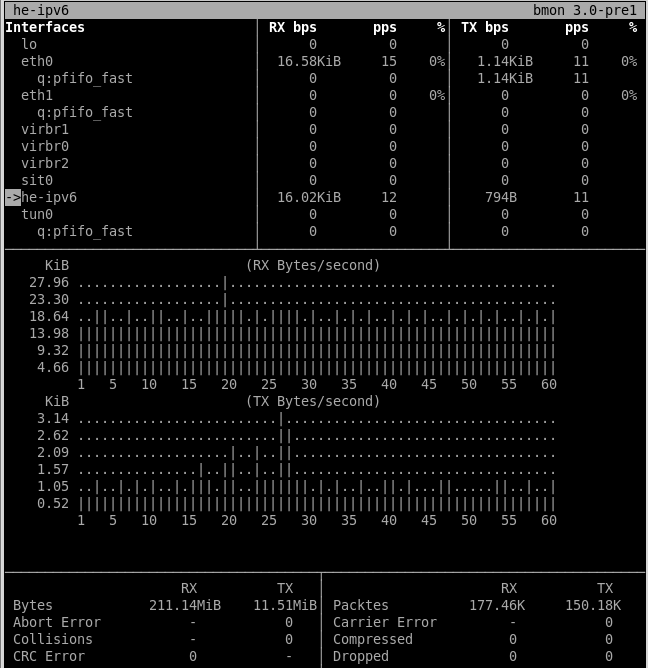
12. bmon
A console-based bandwidth monitoring tool which shows various per-interface information, including not-only aggregate/average RX/TX statistics, but also a historical view of bandwidth usage.
13. iftop
A bandwidth usage monitoring tool that can shows bandwidth usage for individual network connections in real time. It comes with ncurses-based interface to visualize bandwidth usage of all connections in a sorted order. It is useful for monitoring which connections are consuming the most bandwidth.
14. nethogs
A process monitoring tool which offers a real-time view of upload/download bandwidth usage of individual processes or programs in an ncurses-based interface. This is useful for detecting bandwidth hogging processes.
15. netstat
A command-line tool that shows various statistics and properties of the networking stack, such as open TCP/UDP connections, network interface RX/TX statistics, routing tables, protocol/socket statistics. It is useful when you diagnose performance and resource usage related problems of the networking stack.
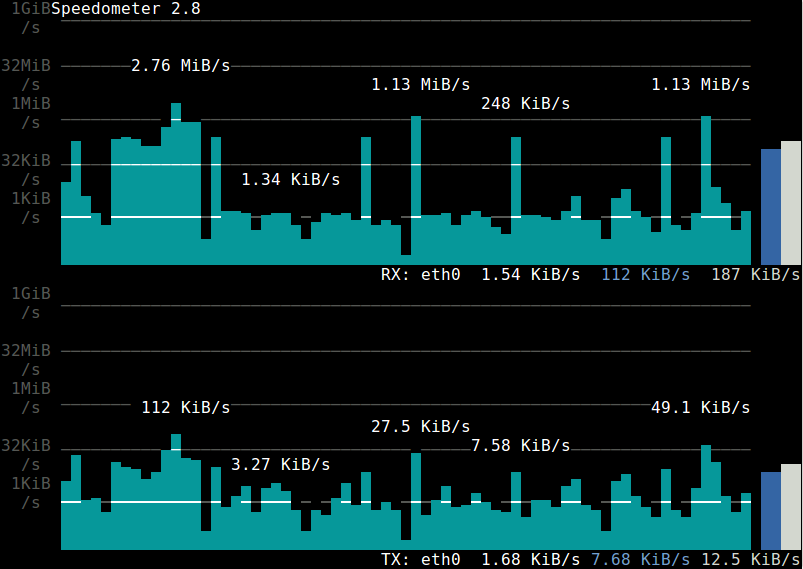
16.speedometer
A console-based traffic monitor which visualizes the historical trend of an interface's RX/TX bandwidth usage with ncurses-drawn bar charts.
17. sysdig
A comprehensive system-level debugging tool with a unified interface for investigating different Linux subsystems. Its network monitoring module is capable of monitoring, either online or offline, various per-process/per-host networking statistics such as bandwidth usage, number of connections/requests, etc.
18. tcptrack
A TCP connection monitoring tool which displays information of active TCP connections, including source/destination IP addresses/ports, TCP state, and bandwidth usage.

19. vnStat
A command-line traffic monitor which maintains a historical view of RX/TX bandwidh usage (e.g., current, daily, monthly) on a per-interface basis. Running as a background daemon, it collects and stores interface statistics on bandwidth rate and total bytes transferred.
Active Network Monitoring
Unlike passive monitoring tools presented so far, tools in this category perform network monitoring by actively injecting probes into the network and collecting corresponding responses. Monitoring targets include routing path, available bandwidth, loss rates, delay, jitter, system settings or vulnerabilities, and so on.
20. dnsyo
A DNS monitoring tool which can conduct DNS lookup from open resolvers scattered across more than 1,500 different networks. It is useful when you check DNS propagation or troubleshoot DNS configuration.
21. iperf
A TCP/UDP bandwidth measurement utility which can measure maximum available bandwidth between two end points. It measures available bandwidth by having two hosts pump out TCP/UDP probe traffic between them either unidirectionally or bi-directionally. It is useful when you test the network capacity, or tune the parameters of network stack. A variant called netperf exists with more features and better statistics.
22. netcat
A versatile network debugging tool capable of reading from, writing to, or listen on TCP/UDP sockets. It is often used alongside with other programs or scripts for backend network transfer or port listening.
23. nmap
A command-line port scanning and network discovery utility. It relies on a number of TCP/UDP based scanning techniques to detect open ports, live hosts, or existing operating systems on the local network. It is useful when you audit local hosts for vulnerabilities or build a host map for maintenance purpose. zmap is an alernative scanning tool with Internet-wide scanning capability.
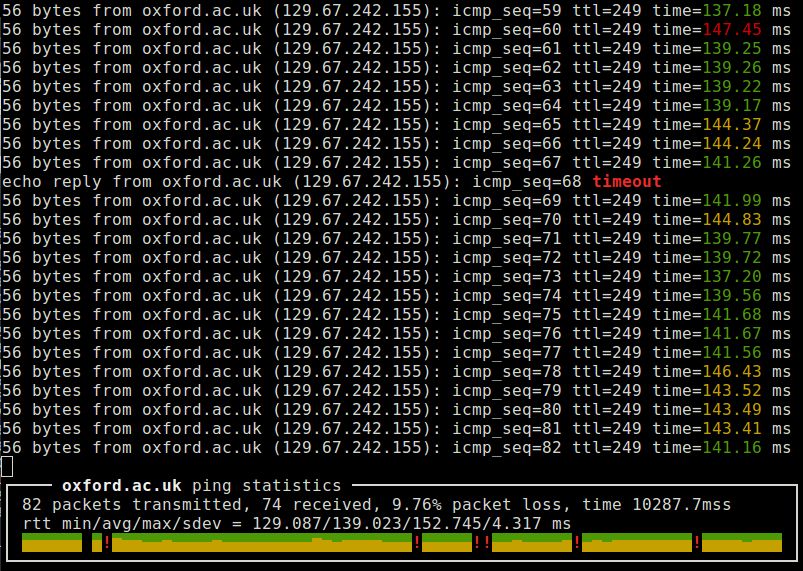
24. ping
A network testing tool which works by exchaning ICMP echo and reply packets with a remote host. It is useful when you measure round-trip-time (RTT) delay and loss rate of a routing path, as well as test the status or firewall rules of a remote system. Variations of ping exist with fancier interface (e.g., noping), multi-protocol support (e.g., hping) or parallel probing capability (e.g., fping).
25. sprobe
A command-line tool that heuristically infers the bottleneck bandwidth between a local host and any arbitrary remote IP address. It uses TCP three-way handshake tricks to estimate the bottleneck bandwidth. It is useful when troubleshooting wide-area network performance and routing related problems.
26. traceroute
A network path discovery tool which reveals a layer-3 routing/forwarding path from a local host to a remote host. It works by sending TTL-limited probe packets and collecting ICMP responses from intermediate routers. It is useful when troubleshooting slow network connections or routing related problems. Variations of traceroute exist with better RTT statistics (e.g., mtr).

Application Log Parsing
In this category, network monitoring is targeted at a specific server application (e.g., web server or database server). Network traffic generated or consumed by a server application is monitored by analyzing its log file. Unlike network-level monitors presented in earlier categories, tools in this category can analyze and monitor network traffic from application-level.
27. GoAccess
A console-based interactive viewer for Apache and Nginx web server traffic. Based on access log analysis, it presents a real-time statistics of a number of metrics including daily visits, top requests, client operating systems, client locations, client browsers, in a scrollable view.

28. mtop
A command-line MySQL/MariaDB server moniter which visualizes the most expensive queries and current database server load. It is useful when you optimize MySQL server performance and tune server configurations.

29. ngxtop
A traffic monitoring tool for Nginx and Apache web server, which visualizes web server traffic in a top-like interface. It works by parsing a web server's access log file and collecting traffic statistics for individual destinations or requests.
Conclusion
In this article, I presented a wide variety of command-line network monitoring tools, ranging from the lowest packet-level monitors to the highest application-level network monitors. Knowing which tool does what is one thing, and choosing which tool to use is another, as any single tool cannot be a universal solution for your every need. A good system admin should be able to decide which tool is right for the circumstance at hand. Hopefully the list helps with that.
You are always welcome to improve the list with your comment!
Support Xmodulo
This website is made possible by minimal ads and your gracious donation via PayPal or credit card
Please note that this article is published by Xmodulo.com under a Creative Commons Attribution-ShareAlike 3.0 Unported License. If you would like to use the whole or any part of this article, you need to cite this web page at Xmodulo.com as the original source.

Xmodulo © 2021 ‒ About ‒ Write for Us ‒ Feed ‒ Powered by DigitalOcean