How to visualize disk usage on Linux
Last updated on November 23, 2020 by Dan Nanni
They say a picture is worth a thousand words. This age-old saying applies to disk usage as well. As your Linux system becomes old, chances are that you start to run out of the disk space. Visualizing disk usage can help you in this case with understanding how the overall disk space is being used, so you can be better prepared to clean it up.
In this tutorial, I describe how to visualize disk usage on Linux.
Baobab is a GNOME disk usage analyzer. Its biggest advantage is the intuitive visualization interface. Baobab can analyze the whole file system tree, a particular directory tree or even remote folders over network.
Install Baobab Visual Disk Space Analyzer on Linux
To install Baobab on Ubuntu, Debian or Linux Mint:
$ sudo apt-get install baobab
To install Baobab on Fedora, CentOS or RHEL:
$ sudo yum install baobab
Visualize Disk Usage with Baobab
For disk usage visualization, launch Baobab as follows.
$ baobab <path to the directory to analyze>
Baobab reports the result of disk usage analysis in two panels: per-directory disk utilization stats are reported in numbers in the left panel, and the overall disk utilization is visualized in the right panel. Note that Baobab does not consider /proc or any other non-plain files such as symlinks, block devices, etc.
Baobab supports the following two different visualization methods.
Ring Charts
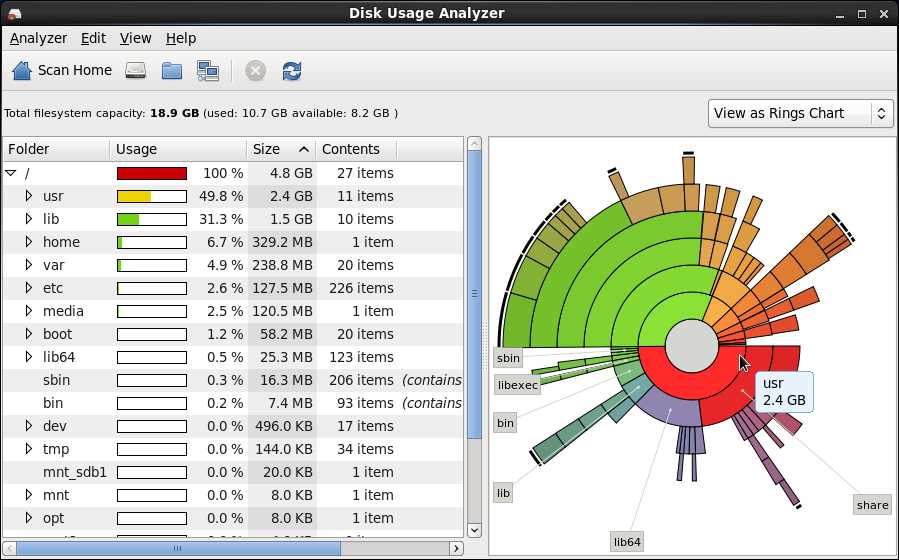
In the ring chart, multiple concentric circles indicate directories in the directory tree, and the center of the circles corresponds to the root of the directory tree. The smaller a circle is, the higher a corresponding directory ranks in the directory hierarchy. If you hover a mouse on any particular directory, it will show the names of its sub-directories on the immediate outer circle. You can tell the relative sizes of the sub-directories by comparing their sizes in a ring-shaped area.
Treemap Charts
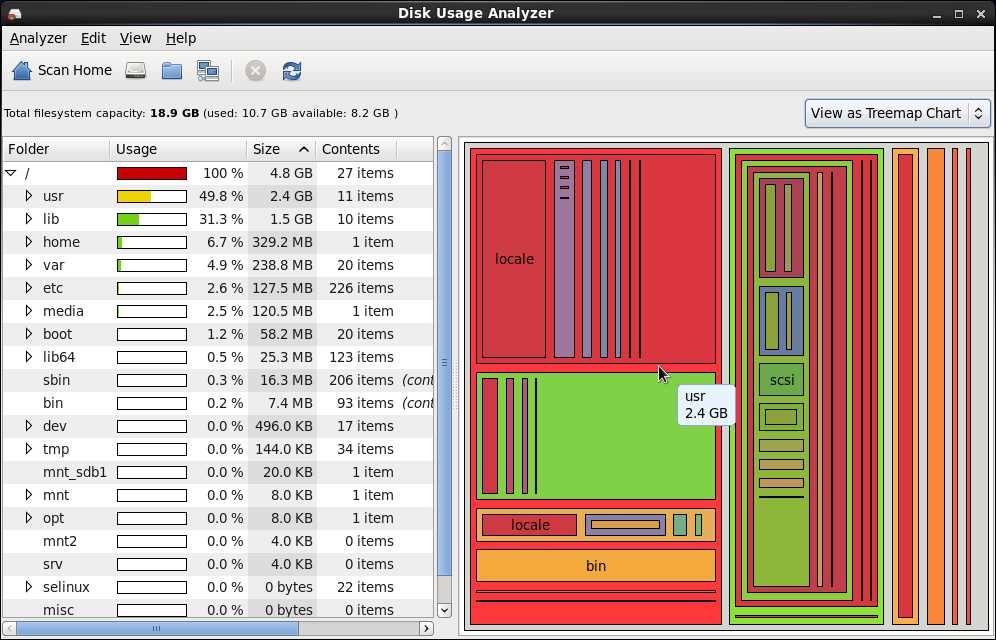
Another visualization mode of Baobap is treemap charts, where overlapping rectangles are used to visualize the hierarchical structure of directories. In this case, the outermost rectangle corresponds to the root of the directory tree, and the inner rectangles to sub-directories. The size of each rectangle indicates the size of a corresponding sub-directory. You can hover a mouse to check the name of a sub-directory.
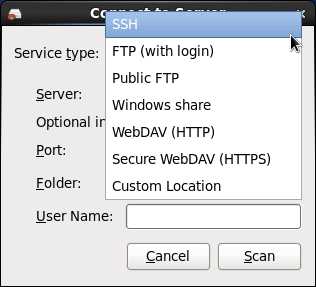
Visualize Disk Usage of Remote Disks
Baobab can analyze local folders as well as remote folders. To examine remote folders, click on Scan a Remote Folder button. Baobap supports SSH, FTP, WebDAV and Windows Share.
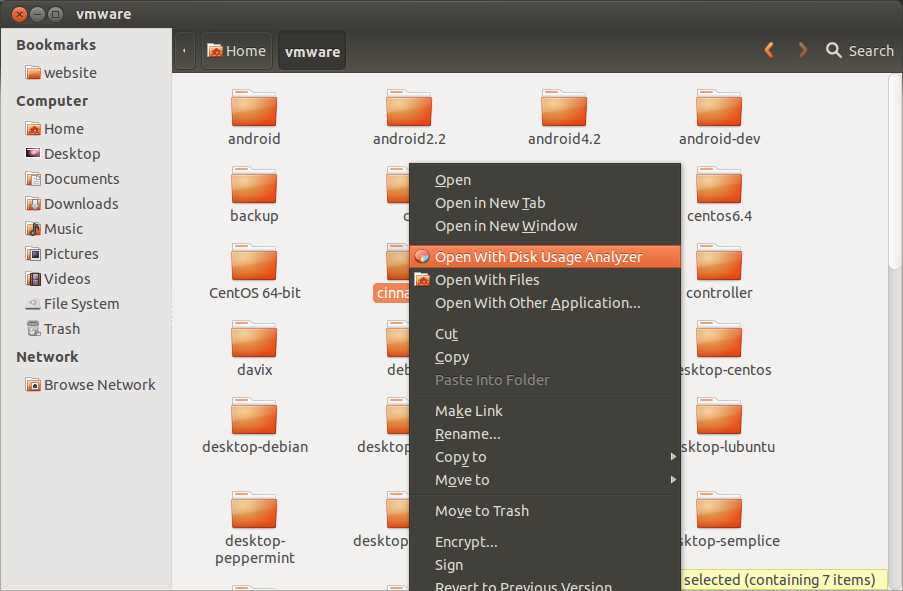
Nautilus Integration
Once Baobab is installed on Ubuntu, you can use Baobab's visual disk usage analyzer within Nautilus file manager. Simply right-click a particular folder on Nautilus, and choose "Open with Disk Usage Analyzer" menu. Baobab works only on folders, not on individual files.
Support Xmodulo
This website is made possible by minimal ads and your gracious donation via PayPal or credit card
Please note that this article is published by Xmodulo.com under a Creative Commons Attribution-ShareAlike 3.0 Unported License. If you would like to use the whole or any part of this article, you need to cite this web page at Xmodulo.com as the original source.

Xmodulo © 2021 ‒ About ‒ Write for Us ‒ Feed ‒ Powered by DigitalOcean