How to find the process ID of a Chrome browser tab or extension
Last updated on August 11, 2020 by Dan Nanni
Google Chrome web browser is built on a multi-process architecture, where different browser tabs, renderers, and extensions are separated out into distinct process sandboxes for security purpose.
Since Chrome web browser runs as multiple processes, it becomes tricky to identify which browser session is the culprit when Chrome goes awry, using up 100% CPU resources.
There are two ways to find out which browser tab or plug-in/extension is associated with which process.
Method One
Right click on the tab bar of Google Chrome, and choose "Task Manager".
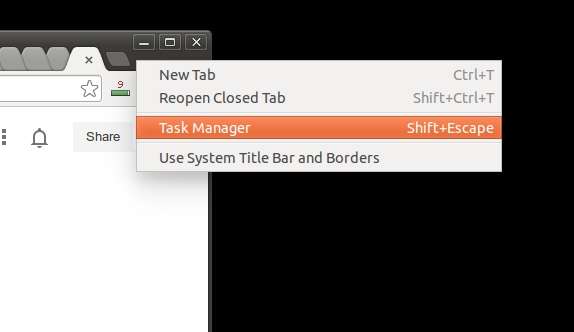
Alternatively, you can also press <Shift+Esc> to open "Task Manager" window directly.
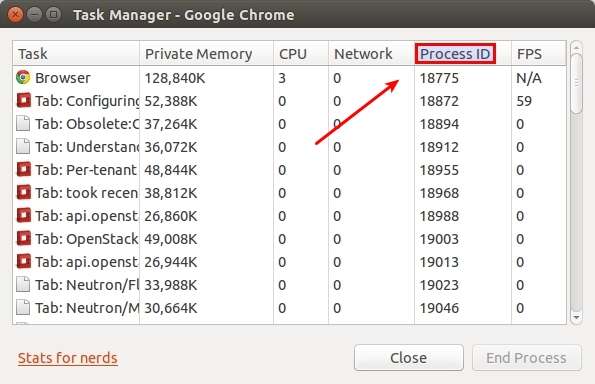
The "Task Manager" window shows a list of tasks (browser tabs or extensions), along with task-specific information. Under "Process ID" column, you can find the process ID of each tab or active extension.
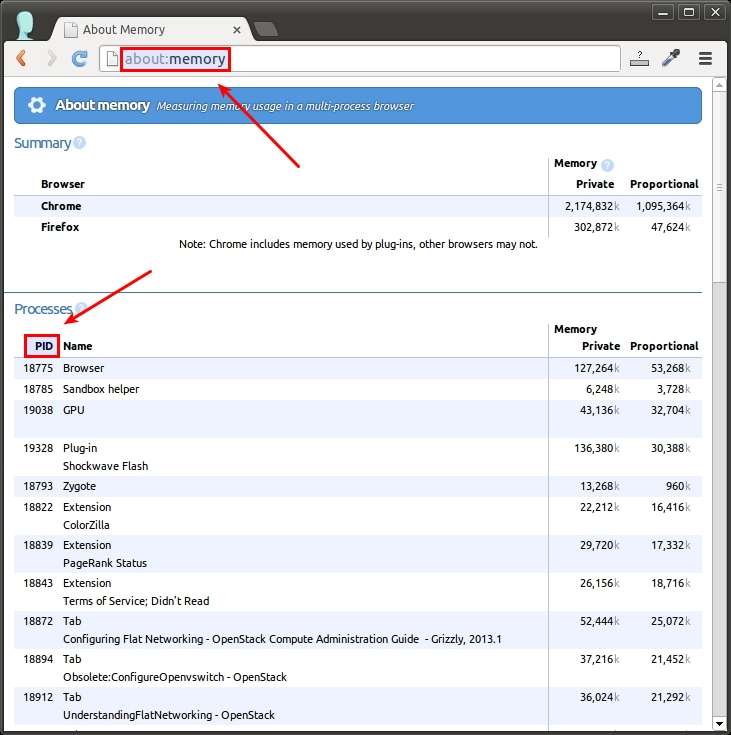
Method Two
Type "about:memory" in the browser address bar, and you can get detailed breakdown of the CPU/memory usage of each browser tab and extension, along with its process ID. From the breakdown, you can identify which browser tab or extension is the culprit for excessive CPU.
Support Xmodulo
This website is made possible by minimal ads and your gracious donation via PayPal or credit card
Please note that this article is published by Xmodulo.com under a Creative Commons Attribution-ShareAlike 3.0 Unported License. If you would like to use the whole or any part of this article, you need to cite this web page at Xmodulo.com as the original source.

Xmodulo © 2021 ‒ About ‒ Write for Us ‒ Feed ‒ Powered by DigitalOcean